
Sifting through NTSB archives has long been one of my interests. This is partly from a career of aviation weather forecasting and partly from crossing paths with Macarthur Job’s legendary Air Disaster book series that went beyond sensationalism, into the engineering and cockpit management aspects of important accidents. (Sadly, Mr. Job recently passed away.)
In that spirit, let’s examine a couple of noteworthy accidents using some of the highest caliber weather products available to meteorologists. Using these tools, we’ll try to figure out where things went wrong. Unfortunately, today’s tools and the expertise behind them weren’t available to the pilots involved in the accidents. But we can use this knowledge to find lessons that can be learned for pilots who might someday find themselves immersed in similar predicaments.
Bonanza vs. Thunderstorm
On October 26, 2010, a massive frontal system was moving through the Midwest states, with a cold front draped along the Mississippi River. Widespread severe weather was in the forecast with a line of storms from the northwest bearing down on Memphis. A pilot at the Memphis-area Olive Branch Airport (KOLV) was preparing for his return flight to Atlanta. He was intent on beating the approaching storm, which was already darkening the western horizon. He was joined by his wife of 30 years.
The instrument flight plan was filed 20 minutes before departure. The NTSB investigation revealed that the briefer was emphatic about the deteriorating conditions. He asked the pilot, “Do you require the latest adverse [weather] conditions?” The pilot replied, “No, that’s why we are getting out of here.” Before ending the phone call, the briefer confirmed, “…you did say you had the adverse conditions?” The pilot said, “Yes, I do.”
The pilot had some experience with dangerous weather. This Bonanza was the pilot’s second airplane. The first was heavily damaged in a storm. Shortly after buying the new Bonanza, the pilot flew through another storm, resulting in new damage. According to the repair facility, the pilot arrived with his weatherbeaten airplane and said, “I did it again.”
The SIGMET for the flight route predicted widespread storms with hail up to 1.5 inches, wind gusts to 70 knots, and tops to 50,000 feet. A tornado warning covered the entire mid-Mississippi River region. Although the pilot skipped the details of the weather briefing, meteorological data was available in the cockpit through a Garmin GNS 430W and a satellite weather-data subscription.
With the gust front approaching and the line just seven miles away, the pilot and his wife took off. They successfully steered away from the line, and climbed toward the filed altitude of 17,000 feet.
However, there was a new line darkening the eastern horizon. This line developing ahead of the main line—a “prefrontal storm”—was already joining into a solid line. About 24 minutes after departure, the aircraft disappeared from radar at 14,000 feet. The wreckage was found a few days later in northeast Mississippi scattered over a 15-mile swath, having broken up in flight.
What Really Happened?
Controllers and investigators immediately assumed the plane had encountered hazardous weather in a thunderstorm, as air surveillance radar showed a storm in progress near the location where radar contact was lost. This was confirmed once the wreckage was found and no malfunctions were noted. But there’s more.
Data from the nearest radiosonde station, Nashville, showed that the level of maximum parcel acceleration was strongest at 15,000-feet. To understand parcel acceleration, let’s look at how forecasters predict thunderstorm behavior. First, a hypothetical parcel of low-level air feeding the storm is analyzed in terms of probable temperature and dewpoint. It’s forced to ascend adiabatically on a Skew-T diagram, and the parcel temperature is compared to the environment sampled by the radiosonde. In effect, this simulates what goes on in the storm.
Instability is determined by how much warmer the parcel is than the surrounding air and the depth of this warm contrast through the atmosphere. The level where the temperature contrast is strongest is the level of maximum parcel acceleration. Strong parcel acceleration produces significant turbulence.
In much of the U.S. the level of maximum parcel acceleration is frequently found between 15,000 and 20,000 feet MSL—right where the Bonanza was flying. This is probably the most turbulent and hazardous altitude range within a thunderstorm. As a forecaster, it makes me suspect that a lot of the 1940s and 1950s airliner breakups in weather were due to this extreme mid-level turbulence.
There’s still more. Freezing levels were calculated to be 14,000 feet MSL, which means the aircraft was on the edge of clear icing and definitely within pelting range of the hailstone factory near the tops of these storms. The filed altitude of 17,000 feet placed the airplane at minus five degrees C—a prime spot for icing.
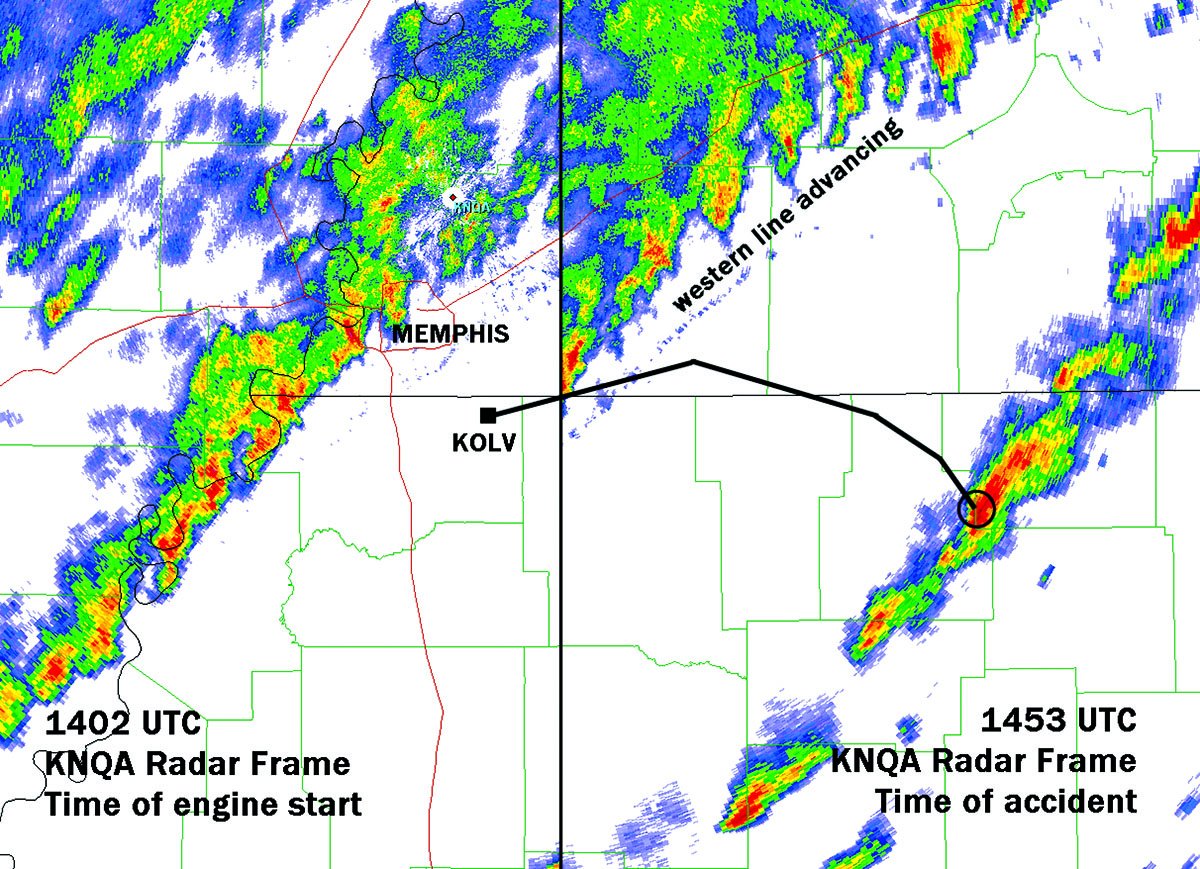
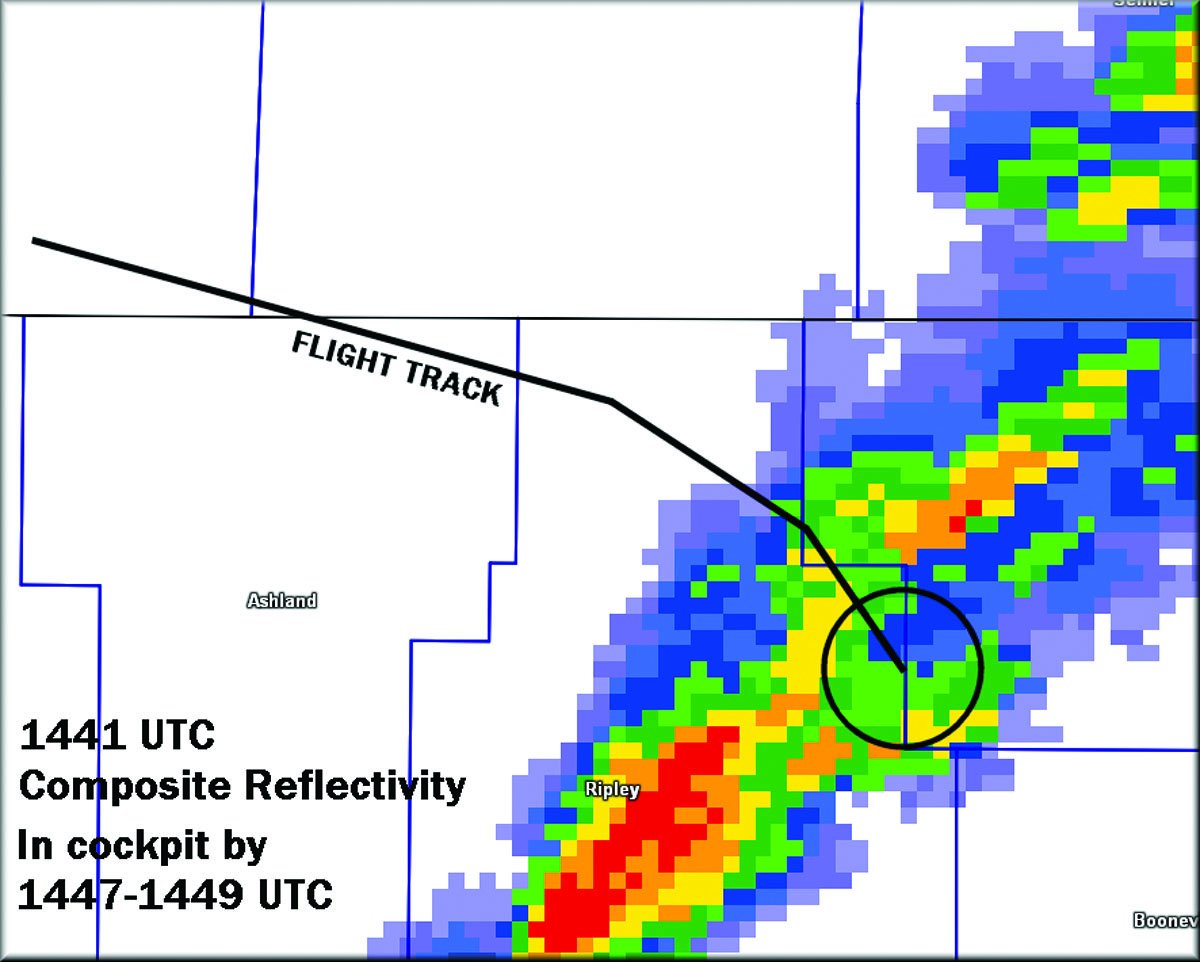
Perhaps the most surprising revelations are on the NEXRAD WSR-88D frames with the flight track superimposed. The composite reflectivity image 13 minutes before the crash (previous page) shows what was likely displayed on board just before thunderstorm penetration, because of the delays in this kind of imagery. The pilot probably saw the same picture, and deviated slightly southeast to avoid the cell further to the north. This was seemingly a wise choice. However the base reflectivity about 10 minutes later at the time of the crash (above) shows a different picture: Instead of a gap, the plane flew smack into a thunderstorm core.
Lesson Learned
What happened? Did the radar fail us? Measurement of cell motion showed that the storm cells were moving at 42 knots. In the 10-15 minutes while the radar data was composited, mosaiced, and transmitted via the satellite datastream, any given cell would have shifted about 10 nm to the northeast. It’s just not possible to outsmart delayed composite radar. Even an experienced meteorologist finds it extremely difficult to account for precise storm motion, and there is no way to pick out actual convective updrafts and downdrafts that are key to storm motion, since composite reflectivity is a blend of all elevations.
This is a reminder that pilots should understand the limits of their technology and never attempt to surgically navigate through or between cells using datalink radar imagery. This data is for broad weather avoidance only. Airborne radar (and possibly ‘spherics detection) remains the only tool available today to get you safely through a storm cluster.
The other surprise is the modest appearance of the cell on radar. From a storm forecaster’s perspective, the cell lacks the classic severe indicators: reflectivity gradient, V-structures, elevated cores, concavities, and shows a top of only about 30,000 feet. Reflectivity was modest, averaging only 55 dBZ, and Doppler velocity products showed weak circulations. Although some message forums suggested there might have been a tornado in the storm, there was no such signature apparent in this storm until later in the day. It’s a prominent reminder, even to me as a practicing forecaster, that ordinary-looking storms can still be deadly.
Interestingly, had the aircraft survived this line, another line was already organizing over northern Alabama. Several tornadoes would later touch down across this region. At the plane’s departure time, NOAA charts showed that 80 percent of the 2.5-hour route was already covered by tornado watch boxes.
Missing in the Sierra Nevadas
On a bright, calm, late-summer morning in 2007, a guest pilot staying at a hunting club near Hawthorne, Nevada enjoyed a leisurely breakfast with the club’s chief pilot. Then they went out to the hangar and checked out the club’s Bellanca Super Decathlon. The pilot said that he would be flying south down the main highway into California, and would enjoy a bit of the scenery along the lee side of the Sierra Nevada and return in two hours. This pilot was highly experienced and had logged over 6300 hours of flight time.
Weather conditions were bright blue VFR. There was not a cloud in the sky. No weather observation was available at the airfield, but ASOS stations surrounding Hawthorne all reported winds ranging from calm to 5 knots. It looked like a perfect day to go flying.
The aircraft never returned. About an hour after the plane was overdue, the chief pilot got in a different airplane and began a visual search, which proved unsuccessful. The Civil Air Patrol joined in later that day, but no radio or ELT transmissions were received. This led to a multi-state search for the plane over the next month. This, too, was unsuccessful, but the search was so thorough that teams found eight previously uncharted crash sites during the operation.
The plane and its occupant were found over a year later by a hiker along a ridgeline east of the Minarets, a rugged mountain chain in the Sierra Nevadas. Ironically, the crash site was only eight miles from the town of Mammoth Lakes, but at an inaccessible point on a mountain slope at about 10,000 feet.
The pilot’s name, for those who were too busy to catch up on the news cycle in those years, was Steve Fossett, celebrity aviator, adventurer and solo balloonist.
What Happened?
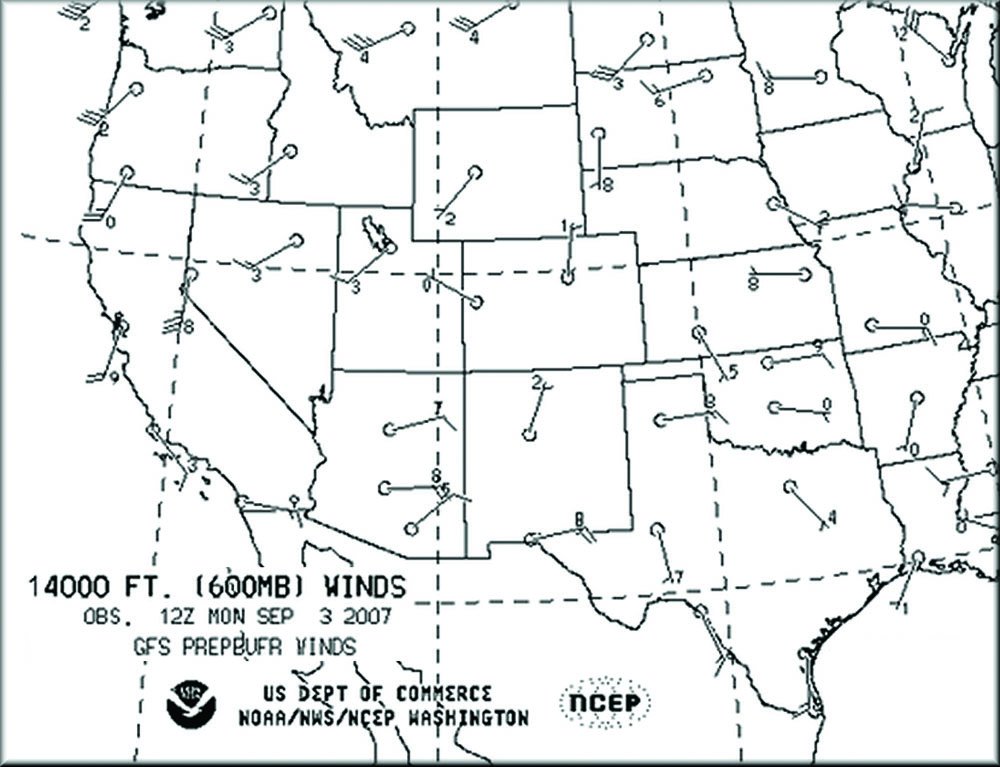
No SIGMETs were in effect, and jet stream energy was expected to affect mainly the Pacific Northwest region. The upper air chart (above-left) reveals one interesting clue, though: 14,000-foot winds had unexpectedly strengthened to 35 knots across the central Sierra Nevada range. This is an important detail that might be missed during a routine weather briefing, or even overlooked during a cursory check of the other charts before going out for some VFR flying.
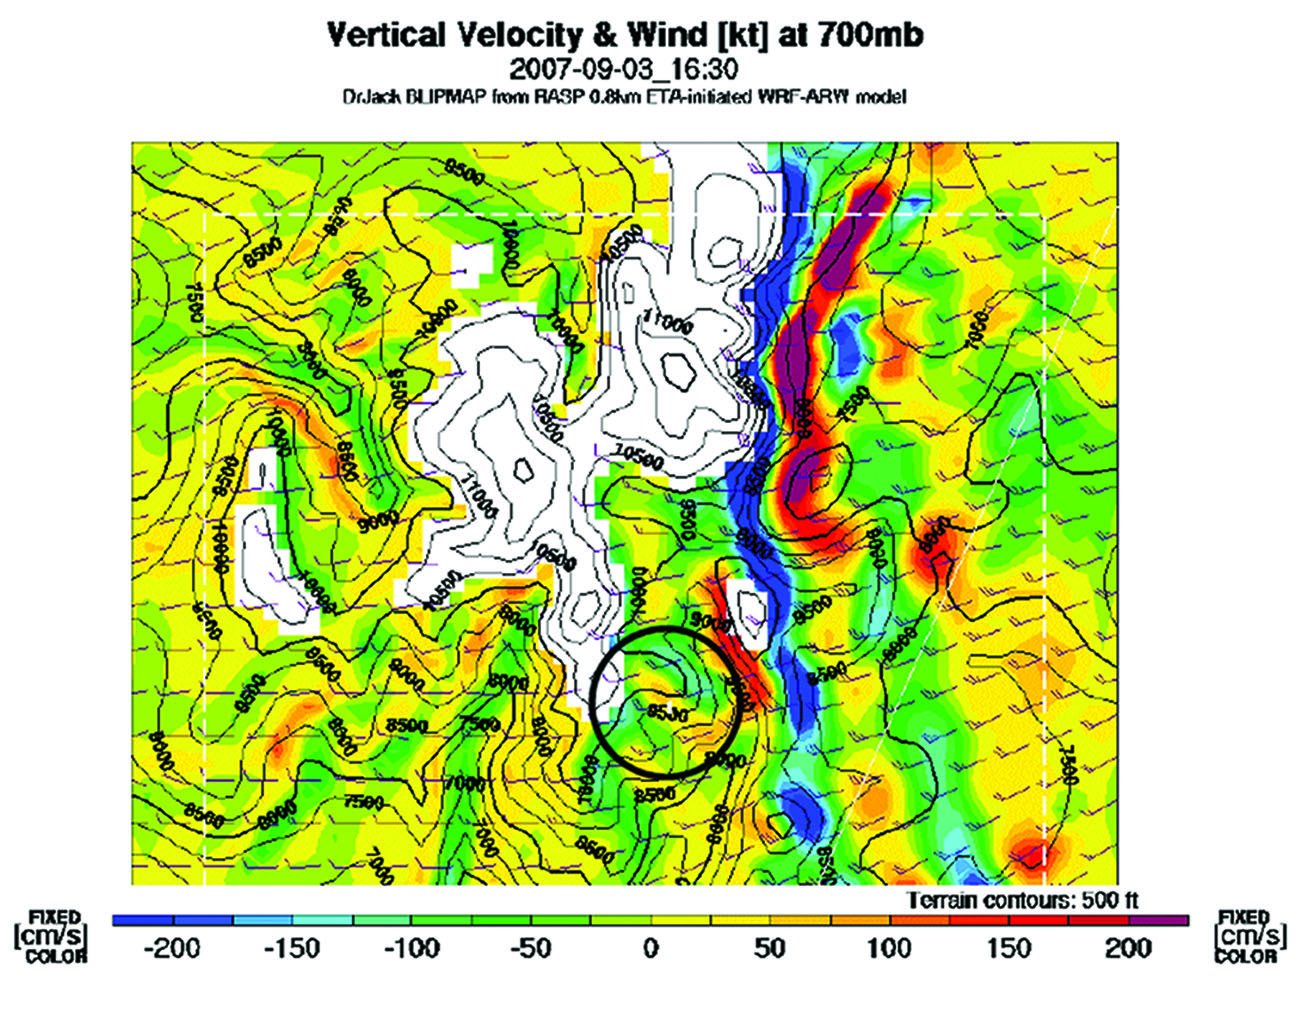
Perhaps the most intriguing clue was uncovered by modeling work done by Dr. Jack Glendening and entered into the public NTSB docket (above-right). This used the WRF model, which is a powerful model that includes terrain interactions. Dr. Glendening’s work revealed that environmental winds of just 10 knots impinging on the Minarets could easily focus and produce localized circulations approaching 25 to 30 knots downstream, producing gravity waves with vertical velocities approaching 400 fpm, definitely enough to cause problems in a hot and high situation. And in this case, temperature deviations at mountaintop level were running on the order of 23 degrees Celsius.
Potent funneling, stretching, and deformation effects in the mountains have been recognized for decades by pilots and aviation forecasters, but it’s a rarity to see them mapped out in such detail. Dr. Glendening’s model uses the latest dynamics and physics packages, and shows just how intense some of the pockets of motion are. Conditions can change significantly in the mountains over just a few miles, or even a few hundred feet. And while modeling results such as these might appear to be the final say in what happened, even these models can easily underestimate the situation if the national-scale data feeding the model is excessively smoothed or important details are not captured well. This is certainly a possibility here, as model data by midday was showing 15-knot winds impinging on the mountain range.
This question entered the minds of investigators after they pulled an automated weather log for a state weather station on Mt. Warren, about 20 miles away and at an altitude of 12,000 feet. They found that the station was measuring winds of 20 knots gusting to 36 knots at the time of the accident, exceeding what even the WRF model had forecasted. It’s worth stressing that the day started out with calm, perfect conditions at the airfield while a worst-case scenario that took everyone by surprise was brewing along the ridgelines.
The lesson here is to give yourself plenty of speed and altitude in unfamiliar terrain, be alert to strengthening wind patterns that aren’t what was expected, and be aware of density altitude considerations. Solicit PIREPs and talk to local pilots who are experienced with the area’s terrain and who might be able to point out the areas to avoid. And exceptionally steep terrain deserves its own mention: the Minarets certainly qualify, as do canyons, mesas, and karst formations. These all have the potential to create exceptionally strong vertical motions and should have you on your guard even if the ASOS stations are reporting light wind.
Tim Vasquez is a professional meteorologist in Palestine, Texas. He offers some extra weather training on his site at www.weathergraphics.com and youtube.com/user/timwxx.


