
With summer approaching, we often think about those hot temperatures, high density altitudes, and storms. But another factor enters the picture: moisture. High relative humidity brings foggy mornings, and with soaring dewpoints comes the prospect for storms and rain.
With moisture having such a profound impact on flight operations, it’s time to take a closer look. Maybe we can even help you understand that dewpoint you always dutifully copy down from the METAR.
Atmospheric Moisture
To truly understand visibility, ceilings, and precipitation as the dynamic processes they are instead of simplified conceptual objects, we need to have a firm understanding of atmospheric moisture. In normal conditions, water in the atmosphere exists not as a liquid but a gas, which we refer to as water vapor. Water vapor is completely invisible, but it can be detected by weather satellites on special infrared satellite channels.
We can measure water vapor directly using wet bulb temperature or dewpoint. For a more technical measure of moisture, forecasters use mixing ratio, which gives the amount of water vapor in grams per kilogram of dry air. This is easier to work with because mixing ratio is a fixed property of the air, while dewpoint fluctuates with pressure.
Regardless, the higher these are, the more water vapor exists for a given volume of air. Forecasters also use a measure called precipitable water (PW). This is a theoretical measure of how much rain would fall if all the water vapor in a vertical column was converted to liquid and fell on the Earth’s surface. It’s expressed in inches.
This is useful because it takes into account the depth of the moisture. A combination of weak atmospheric winds and high precipitable water indicates the potential for flooding rains. While floods don’t generally affect your flight plans, high precipitable water values are often correlated with restricted visibility due to haze, especially in the summer.
Water vapor affects your flying activities when condensation occurs. This is the conversion of the gaseous phase of matter to liquid. Similarly, flying conditions improve when there is evaporation, the conversion of liquid water back to a water vapor. We avoid the complication of the underlying physics, but we will focus on condensation and evaporation.
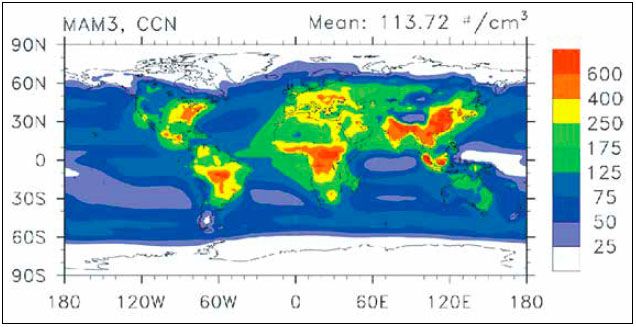
Condensation normally doesn’t occur without cloud condensation nuclei (CCN), microscopic particles that allow condensation to occur. The air is filled with them, and they can consist of microscopic clay particles, fine dust, fine soot from distant wildfires, organic matter, and even the fine combustion particles from your aircraft engine. Without a CCN, condensation generally doesn’t occur except in extremely cold conditions, below about -40 degrees. But if CCN are abundant or involve highly hygroscopic molecules, like sulfur dioxide and other pollutants, condensation can occur in moderately humid air that would otherwise be clear, and we get haze.
Through condensation, gaseous water vapor becomes a water droplet. These droplets are incredibly small, around 20 microns. You’d need over a thousand to measure an inch. Most of the time in a shallow, fair-weather cloud, they are about that small.
However, processes like collision and coalescence can cause them to grow. (See our Icing article, October 2020.) At 100 microns in size, they form drizzle droplets that slowly fall to earth, and passing 1000 microns (1 mm) in size, rain droplets are formed, which fall to the ground in minutes.
Humidity, Moisture
That brings us to the concept of humidity. In casual conversation we often think of this as relative humidity, where at 100 percent the air is saturated and clouds and fog tend to develop. However there is also specific humidity or absolute humidity, which considers the total water vapor without regard to anything else. Obviously “humidity” by itself is an ambiguous word, depending on the whims of whoever uses it, so we always prefer to avoid this vague terminology and use more appropriate expressions. To myself as a forecaster, “humidity” just tells me that moisture is present in some sensible form.
Another ambiguous word is “moisture.” In forecast terminology this encapsulates both water vapor and cloud droplets—anything that hasn’t yet fallen out of the atmosphere. In a forecast office, this word is basically a broad synonym for dewpoint, mixing ratio, or precipitable water.
Let’s explore relative humidity. We can use the concept of a glass of water that grows when the air is warm, and shrinks when the air is cold. I need to emphasize that this is an oversimplification, but it will help us understand the basic concepts. The size of the glasses yields a “holding capacity” dictated mainly by the temperature. This property can be described as the saturation mixing ratio, while the actual water in the glass is given by the dewpoint temperature or the plain mixing ratio.
If we divide the mixing ratio by the saturation mixing ratio, we obtain the relative humidity. This is a little like dividing the dewpoint by the temperature, but that doesn’t give useful numbers. A proper workaround is to use the spread between temperature and dewpoint, in degrees, known as dewpoint depression. This is a technique you can readily use in the cockpit as you read a METAR report or listen to the ATIS broadcast. Take note of that spread and it will give you a sense of what the ceilings and visibility are likely to do.
In meteorology we have a rule of thumb for dewpoint depression. A dewpoint depression of five degrees C or less correlates roughly to a relative humidity of above 70-75 percent. Whenever this condition exists, we consider the possibility of cloud or fog where it is measured. In other words, if the value came from an ASOS station, fog or haze may exist at the surface, while if it came from a radiosonde sensor it could mean clouds at the altitude where the reading was taken.
As the dewpoint depression closes in on two degrees C or less, indicating a relative humidity of 90 percent or higher, the chance of clouds or fog increases rapidly. At a dewpoint depression of zero, the relative humidity is 100 percent. Clouds or fog should typically be present, but if CCN are unavailable or are poor quality, the clouds or fog might not form. In laboratory chambers purged of CCN particles, it’s actually possible to raise relative humidity to over 400 percent without any cloud droplets forming. In the real world, though, clouds usually form at 100 percent since CCN particles are usually abundant, especially in the tropics.
A depression exceeding five degrees C almost always rules out clouds or fog and suggests good visibility, unless precipitation is falling from a higher layer, or an unrelated obscuration like dust or wildfire smoke is present.
One use of dewpoint depression is estimating height of the bases of cumulus clouds. Using the dewpoint depression from a surface observation, divide by 2.5 and multiply by 1000 to get the approximate height in feet. For example, if the temperature is 30 C and the dewpoint is 20 C, we get a height of 4000 feet AGL. This rule of thumb is widely used to estimate cloud heights in general, but it only applies to cumulus clouds in relatively quiet weather, and with a well-mixed troposphere like you might find in the western states during the warm season.
So far we’ve learned that relative humidity and dewpoint depression are important when we’re evaluating the possibility of fog or low clouds. If you look at forecast models on sites like College of DuPage and Pivotal Weather, you’ll find many of the upper-air charts plot the relative humidity at various levels. This is specifically designed to help forecasters find two things—the location of cloud layers and how close the atmosphere is to saturation. But it doesn’t offer much more.
We also can infer that when the temperature falls to the dewpoint, the dewpoint depression becomes zero and clouds will form. This is precisely what happens in the atmosphere when there is lift. Atmospheric parcels undergo adiabatic cooling, and the temperature falls to its dewpoint.
What About Dewpoint?
Dewpoint temperature is a little different. As we explained, it’s tied closely to the actual, physical amount of water vapor in the air. As a meteorologist I like to use dewpoint and mixing ratio to learn the total amount of moisture the atmosphere has to work with. This becomes especially critical during severe weather, because low-level dewpoint and mixing ratio contribute to the total available energy in an updraft, and are the largest contributors to instability. This is why dewpoints in the 60s and 70s during transition seasons are so closely associated with hail, high winds, and tornadoes.
Relative humidity isn’t as important in severe weather forecasting, but in the 1980s and 1990s forecasters discovered that the average relative humidity feeding into a supercell is closely tied to the downdraft temperature, which in turn shapes tornado development. Forecasters actually use a measure called lifted condensation level (LCL) because of its relation to cloud base height, but don’t let that confuse you: it’s just another expression of relative humidity.
When surface relative humidity is high in severe weather, the tornado probability is higher. Conversely, in low relative humidity environments, like you might find in Denver and Salt Lake City during the summer, microbursts are favored. Low relative humidity in the middle troposphere counts as well, and this is why we can get derecho storms and strong downburst storms in places like Missouri and Ohio even when relative humidity is high.
Fog: Serious Moisture
While clouds are fairly predictable, forming anywhere there’s sufficient relative humidity and lift, fog can be more complicated. Fog is perhaps the ultimate manifestation of moisture and affects aircraft at critical phases of flight. In METAR observations fog (FG) can only exist when the visibility is less than 5/8ths of a mile, otherwise it must be reported as mist (BR). This is a cosmetic and needless distinction. The two phenomena are exactly the same, except for different visibility. So for meteorological purposes, you should treat both of them as fog.
Most fog events in quiet weather consist of radiational fog. This occurs on a clear night when the Earth radiates its heat into space. The surface temperature cools to its dewpoint temperature, the humidity approaches 100 percent, and cloud droplets form. If the drops are large enough, we see them as a fine drizzle.
Why doesn’t every night produce fog? Most of the time the air is dry, and the air never cools to the dewpoint temperature. Dry vegetation and soil contributes to this effect. Sometimes a light wind keeps the air mixed, bringing dry air to the surface and dispersing moisture aloft. On other nights there’s an overcast cloud layer, which dampens outgoing radiation and prevents much cooling. If the last time you were out on a night that wasn’t foggy, chances are those were the reasons.
However a notorious process that aids fog development is a wet surface, such as from recent rains. Agricultural areas and well-sheltered valleys that prevent inversions from being dispersed also favor fog formation. The San Joaquin Valley of California in the wintertime is a prime example.
As you might expect, radiational fog burns off the next morning. By “burning off,” we mean that solar heating warms the atmosphere, increasing the temperature and reducing the dewpoint depression. Thermals and convective updrafts also disperse the moisture hundreds and thousands of feet vertically into the atmosphere. Drier air sinks to the surface to fill the void.
Not all fog forms from radiational cooling. Sometimes moist air moving over a cold surface is cooled to its dewpoint. This is common north of warm fronts in the Southeast states in the wintertime, as well as in coastal waters off California. We refer to this as advection fog. Unlike radiational fog, this can happen over lakes and oceans due to the cold water temperature.
Finally there’s frontal fog, which is a bit of a misnomer as it’s actually associated with precipitation transporting large amounts of moisture downward into a cold air mass. The cold air mass then saturates. As with advection fog, it also occurs north of warm fronts and anywhere there are large areas of precipitation. Frontal fog often has great vertical extent and can merge with the overlying clouds.
In closing
Admittedly the topic of moisture can be (ahem) pretty dry. Thankfully we’ve avoided the math and the heavy physics. Hopefully now you have better insight into this mysterious corner of aviation weather, and perhaps you’ll have some ideas of what it means the next time you hear a reported dewpoint


Thanks for the article Tim. A question- you wrote that dew point fluctuates with pressure. Can you explain? As I recall in doing lifting condensation level (LCL) calculations, the dew point of an air parcel is only a function of the mixing ratio or saturation vapor pressure and temperature. It only varies with pressure above the LCL, when water vapor can transition to water droplets and leave the air.
@Fred: Why do you think it only varies about the LCL? I think you are conflating when a dry air parcel is actually saturated (when a dry air parcel lapse rate meets the saturation mixing ratio) against just the dew point – the dew point change regardless of whether or not the air is saturated.