
This article is being prepared in the middle of the winter, and there’s probably no better time to talk about ceiling and visibility. These are the main parameters that determine whether or not we’re flying in instrument conditions, and if we’re unprepared, low ceilings and visibility can get us into serious trouble.
Ceilings in History
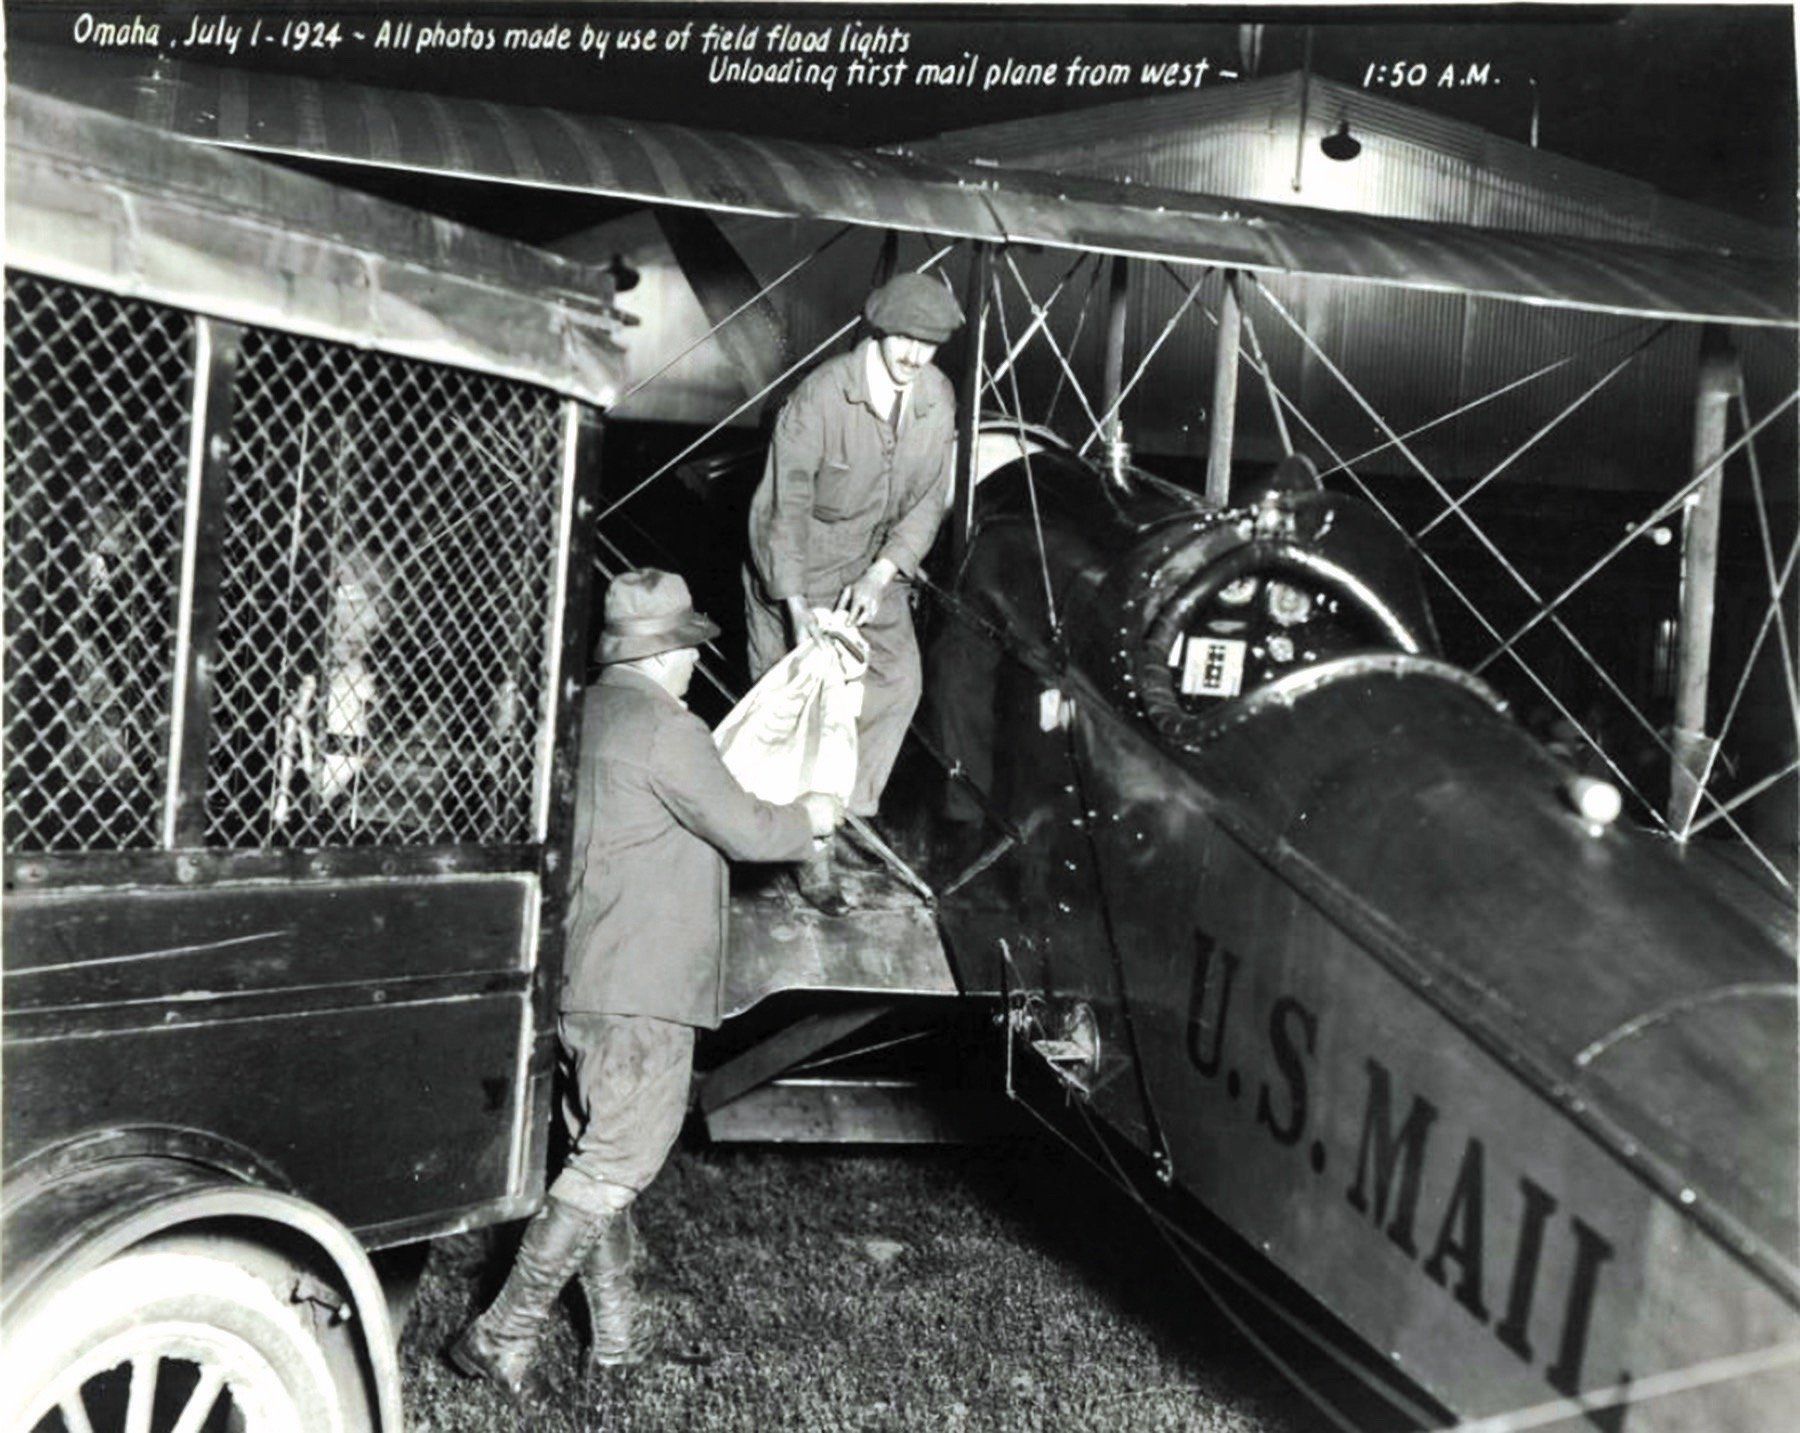
It was a simpler time when the Red Baron appeared in the French skies during World War I. Pilots stuck to clear air and avoided clouds where possible. Instrument flying got its start in the 1920s. The revolutionary U.S. Air Mail service grabbed national headlines and promised to be one of the biggest advances since the Pony Express.
The nature of the business required that airplanes be flown at night for a New York package to be delivered to Chicago the next day. And a schedule meant that encounters with bad weather were inevitable. This put aviators in dangerous new territory to meet the deadlines. Early in the 1920s it was calculated that a pilot’s odds of dying were 1:1 after completing 100,000 cross-country miles.
These early pilots depended on a network of rotating beacon towers at four-mile intervals, like lighthouses in the sky. These facilities, operated by the federal government, used lamps powered by cylinders of acetylene. Simply by following the route from beacon to beacon, a pilot could arrive safely at the destination. Weather could be avoided because the planes flew at low altitudes, and illuminated diversion airfields were placed at frequent intervals. If the pilot felt things were deteriorating, he could be on the ground in less than 10 minutes.
This system wasn’t good enough for the emerging airline industry, whose airplanes flew at higher altitudes across varied routes. This sparked massive advances in weather observation, data dissemination, and forecasting. By the 1930s the airlines all had their own meteorology departments. And true instrument flying arrived in the mid-1930s with the low-frequency radio range (LFR) system, promoted by Jimmy Doolittle in 1929. Instrument flight grew rapidly as a practical reality.
Enduring Standards
This increase led to widespread standardization of ceiling and visibility measurements. Surprisingly, the definitions haven’t changed much since those early days. In the United States, the bible is the Federal Meteorological Handbook #1, published by the Federal Coordinator of Meteorology.
Visibility is the maximum distance in a specific direction at which objects can be seen and identified—an important distinction; just seeing objects isn’t good enough. Prevailing visibility, which is the primary visibility measurement we see in METAR reports, is the maximum visibility figure valid for half of all directions around an observer. As we’ve discussed previously, automated stations like ASOS estimate this figure with a spot check of a one-meter volume of air at the sensors, but in much of the world prevailing visibility is taken the old-fashioned way: looking all around at the horizon.
Ceiling is the lowest height, above ground level, at which a cloud layer covers more than half of the sky. This is defined by the base (the undersurface) of each cloud layer.
But, this is a cumulative measurement that includes all lower layers, so if the sky is half covered with stratus at 500 feet, and a higher 1/8 layer of stratocumulus can be observed at 2000 feet, we consider the ceiling to be 2000 feet. The stratocumulus in this example is considered to cover 5/8 of the sky, even though we can’t observe it all.
Remember, ceilings and values marked CIG are always reported in height AGL. The exceptions are in area forecast products, any cloud height reported as MSL, or PIREPs where clouds are encoded as given by the pilot and can be either (usually MSL). Always make sure you know which height is being reported.
A special form of ceiling is vertical visibility. When the sky is blocked by obscurations like fog, snow, or rain, we simply measure the vertical visibility, beyond which a ceilometer beam is extinguished. You may have seen or heard the term “W0X0F”, pronounced wawks-off. Before 1996 when the U.S. adopted the METAR format, this essentially meant an obscured zero vertical visibility (ceiling) with prevailing visibility zero miles in fog—the worst it got. Nowadays this is encoded “0SM FG VV000.”
From the 1920s to the 1950s, weather observers released “pilot balloons” to estimate ceiling height. A balloon with a known rate of ascent is released and timed with a stopwatch. This technology was replaced by the rotating beam ceilometer, which in turn was phased out around 1990 and replaced with the laser beam ceilometer, which is widely used today.
Both of these instruments only measure the ceiling that exists within a vertical beam directly above the sensor. Before the 2000s, when many stations had a human observer, the spot measurement of ceiling was just one piece of data that was used to assemble a complete and accurate report of the sky condition. Now, with automated stations like ASOS, this spot reading and its trend over the past hour are all the information that’s available, and this means that there can occasionally be unexpected differences between the actual ceiling that exists and the one being reported.
Whiteout
A broken or overcast cloud above you and snow-covered ground below you or, in rare instances, poorly illuminated seas and lakes instead of snow cover, can lead to a situation where the cloud layers and ground blend to produce a misleading horizon. This is called a whiteout.
Whiteout conditions were blamed for the 1979 controlled flight into terrain in Antarctica of a DC-10, Air New Zealand Flight 901. This tragedy killed 237 tourists and 20 crew members. Initially it was thought that the impact occurred in cloud, but photos recovered from victims’ cameras revealed excellent visibility of the terrain during the minute before impact. Test flights that were conducted in 1980 with a photographer on board revealed the smoking gun: ceilings seamlessly blended with mountain slopes, producing a phenomenon known as sector whiteout. The crew, though highly experienced, had not been trained to recognize sector whiteout.
Many of the hard-won lessons about winter flying and sector whiteout were learned in Canada’s challenging high-arctic environment, where thousands of logistics flights were conducted along the DEW Line radar chain during the Cold War. It comes as little surprise that some of the best information nowadays on sector whiteout is found in Canada’s Aeronautical Information Publication (AIP).
What is most troubling about sector whiteout is that pilots frequently encounter it but are unable to recognize it. The Canadian AIP recounts how many pilots have accidentally impacted snow-covered terrain and frozen lakes, even while clearly observing visual references on the ground during the seconds before impact. The advice to stay safe in these conditions is simple: let your instruments—not the view—be your primary reference.
Meteorology
H ow can you use your weather knowledge to anticipate ceiling and visibility changes? Your experience has probably taught you that visibility and ceiling are often closely associated. After all, both conditions are technically identical: ceiling is a cloud, while reduced visibility is often caused by fog, which is simply a cloud on the ground.
Both are caused by production of microscopic cloud droplets as the air mass approaches saturation. The cloud droplets absorb visible light and reduce the atmosphere’s transparency. When the ceiling drops below 3000 feet, the visibility often diminishes. Likewise when fog sets in, a low ceiling often follows. Lacking specific additional information, these are your best rules of thumb.
But sometimes we see differences between visibility and ceiling, and the key is in the weather pattern. For example, strong dry air advection or cold air being strongly modified by a warm dry surface will cause a reduction of relative humidity close to the ground. So even with a low overcast being caused by residual moisture, the visibility can be excellent close to the ground.
You’ve probably seen this if you’ve ever flown into Chicago in the winter with a strong northwest wind, just behind a departing cold front. Even though the air mass is frigid, it is still being heated by a relatively warm ground. This brings the surface relative humidity down to about 60-70 percent even while it’s nearly saturated in the clouds. Gusty winds are a good indicator of a warming air mass.
And the reverse situation, low visibility with the lack of a ceiling, happens often in conditions favoring radiation fog—damp ground and clear night skies. This is basically a cloud that forms from the ground upward. Visibility is the first thing to disappear, even with stars visible overhead, but as the fog deepens, eventually the ASOS will begin reporting reduced vertical visibility.
Forecasting Changes
To figure out if instrument conditions are expected, many aviation meteorologists take a three-pronged approach. First, they look at the current situation. Maybe fog is expected but hasn’t formed yet. Second, they examine the pattern and the underlying ingredients. Third, they put the current situation and the pattern together to see whether things will improve or get worse.
The first technique involves looking at all available data. Using tools like AWIPS, the author’s own Digital Atmosphere software, or sites likeSkyVector.com,. the forecaster will draw highly localized METAR station plots covering only a couple of hundred miles or less, so that all available stations are shown.
For example, showing New York JFK Airport and Newark isn’t good enough. We also want to look at La Guardia, Teterboro, Central Park, Linden, and every other scrap of data we can get. The ceiling and visibility at each of these sites is reviewed to see how things are looking or where fog and ceilings are starting.
Then we turn to the meteorology. Is it a clear night? That means radiation fog in high humidity and ground moisture. How is the temperature-dewpoint spread? If it’s less than five degrees, fog is a possibility. What is the wind doing? A strong wind is usually good for improving visibility, as it transports dry air to the surface and removes saturated surface air.
We also need to consider the larger weather pattern. What air mass do we have and what’s happening to it? In FAA Manual AC 00-6B, Aviation Weather, you’ll want to look at Chapter 10, Air Masses. Unfortunately since the 1980s the study of air masses has taken a back seat to computer models. Air masses are even glossed over in ground school. But the fact is that dynamical models are still not very accurate forecasting visibility and ceiling. The aviation forecaster has job security, and a good analyst still relies on the underlying fundamentals.
Part of this skill is understanding what kind of air mass is present and how it’s being changed. For example, the worst pattern for instrument conditions is a warm, humid air mass being cooled from below. You might see this across Texas or Georgia during the cool season with southerly winds. The warm air passes over the cool ground, and is chilled to its dewpoint, causing ceilings and visibilities to drop.
Likewise a favorable pattern for visual conditions is a cold air mass being warmed from below. This increases the temperature-dewpoint spread, decreases relative humidity, and encourages evaporation of any fog or cloud. Of course important things might be happening at other levels in the atmosphere. For example even with dry northwest winds at Cleveland, a lake-effect snow shower off Lake Erie will quickly shut down flying at local airfields.
Finally we put all this information together to understand how conditions will change at each airport. While the physics in the atmosphere are all the same, some airports are more prone to fog problems than others, perhaps due to elevation or local effects. How the forecaster puts all this information together is a bit of a black art, but it’s not too difficult to understand as long as you have the basics down.
There are a few tools that can help. Of course, use the TAF if available; it’s one of the highest quality forecasts you’ll get. Where a TAF isn’t available or you want to second-guess it, look at trends in the MOS forecast data (“Hidden Weather Tool” March 2018). It isn’t the exact visibility and ceiling numbers you want, as they can be hit or miss, but rather you want to look at the trends across the hours of interest. This kind of information paired with observed and pattern-based data will give you an excellent idea of what to expect.
We’ve presented a thorough rundown on ceiling and visibility that will give you a lot to work with when it’s 2 a.m. and you’re debating whether to go ahead and file that flight plan. Remember it all comes down to basics: if you’ve got a solid grounding in meteorology, you’ll have a definite edge on the other pilots heading into that same airport. Stay safe!
REPORTABLE SKY COVER DEFINITIONS | ||
ABBREVIATION | MEANING | COVERAGE |
VV | VERTICAL VISIBILITY | 8/8 |
SKC OR CLR | CLEAR | 0 |
FEW | FEW | 1/8 – 2/8 |
SCT | SCATTERED | 3/8 – 4/8 |
BKN | BROKEN | 5/8 – 7/8 |
OVC | OVERCAST | 8/8 |
Tim Vasquez has helped thousands of Air Force pilots from T-38s up to C-5s safely navigate the worst of ceilings and visibility. He now consults and writes meteorology books from his home in Palestine, Texas.


