
When winter arrives, it’s nice not to have to worry about big thunderstorms, high density altitudes, and being bounced all over the place flying the local pattern. But winter brings a few tradeoffs: a big increase in IMC, stratified precipitation, icing, high-level clear-air turbulence, all-day windstorms, and of course the short daylight hours.
The biggest flying hazards come with well-developed winter storms. These bring all the winter dangers in one convenient package. In the Northeast states, winter storms that interact with Gulf Stream waters and undergo rapid development along the coast are common enough that they’ve been given a name: the nor’easter. They’re responsible for the vast majority of the intense winter weather affecting that part of the country.
Many pilots continue to fly in these systems anyway. While routine flights can be accomplished and the risk is manageable with proper planning, the unprepared can quickly get into serious trouble.
The NTSB database continues to fill up—even in the last year—with the epitaphs of pilots who received a full weather briefing, yet were fully confident they were in control, at least up until the final moments of their flight. Whether the cause of an accident is hastiness, oversight, or poor training, the resulting accident usually boils down to applying a series of poor decisions to the given weather scenario.
As an aviation forecaster, I’ll try to give you the perspective from the forecast counter and show you how these systems come together and how the hazards develop. A little awareness and perspective from the forecast side will almost certainly help you understand what’s happening when you’re up there in the ice, the TAF has busted, and your alternate is looking questionable. Let’s break it down.
Winter Storm Formation
From a meteorological perspective, there’s really nothing particularly special about a winter storm. These are ordinary surface lows just like you might see in the spring or summer, except that they’ve deepened and matured while entraining large amounts of cold air from the north, and warmth and moisture from the south (unless you’re in the southern hemisphere, in which case these are reversed). Both of these ingredients are critical to creating the winter storm shown below.
The origin of this air is important. The cold air normally flows in from Canada, the Great Plains, or the Great Lakes region. A long period of clear weather atop a layer of fresh-fallen snow cover provides the best factory for cold air. Fresh snow is the key, because snow gradually settles and squeezes out the trapped air, which just like a thermos provides the true source of insulation. The cold air is not only important for providing subfreezing weather and frozen precipitation forms, but also in providing a source of very dry air that helps generate even more cold air through wet-bulbing, when moisture falls into this air and evaporates.
The warm air and moisture originates from the Gulf of Mexico or a long circuitous route from the tropics. The Gulf Stream waters along the East Coast are also an important source, and this leads to the explosive cyclone development we sometimes see along the coastal regions. Moisture isn’t just important for the clouds and precipitation, it also provides latent heat that helps to power the system. Latent heat is extra heat that is released into the air when moisture condenses and forms cloud droplets.
The horizontal contrast between cold and warm air forms a baroclinic zone that helps supercharge the upper troposphere by steepening horizontal pressure gradients and increasing the wind flow. This is directly responsible for the development of the polar front jet stream. In turn, the strong dynamics associated with the jet stream help deepen the surface low. This is the baroclinic instability mechanism and creates a chain reaction that is only broken when cold air fully wraps all the way around the surface low, known as the occlusion process.
Finally there are the fronts. When evaluating weather or your destination airfields, it’s always a good idea to know which side of these fronts they’re on and which way the fronts are moving. When you’re north of a warm front, precipitation forms tend to change over time to progressively warmer types, usually in the sequence of snow, sleet, freezing rain, then liquid rain. This is due to the appearance of progressively deeper warm air just above the surface, and a reduction in the depth of the cold air hugging the ground. When this air becomes less than about 1000 feet deep, freezing rain is the favored form if seeded by rain or melted snow.
Likewise when you’re behind a cold front or west of the surface low, you’ll see a reverse progression. But sleet and freezing rain are rare in these areas since the warm moist air currents are much further east. As a result, rain changes over to snow with little fanfare. But on rare occasions, channels of warm moist air in the mid-levels may reach these areas, known as conveyor belts. We’ll talk about them shortly. Forecasters keep a close tab on where these conveyor belts are, as that’s where the most intense and varied precipitation forms occur.
That’s all the nuts and bolts of winter storm development. The rest is just details. Certainly it’s important to know where the cold front and the warm front are, as that defines the limits of the cold and warm air, but as you’ve probably guessed, it’s the air masses that are the real stars of the show. Now let’s take a closer look at a winter storm.
Focusing On Hazards
A good place to start is the surface chart. Even if you don’t fully understand them, take note of where the fronts and the surface low are. This is still good information. You can find surface charts at the NOAA Aviation Weather Center website under the Observations and the METARs tab, or by visiting the NOAA Weather Prediction Center website.
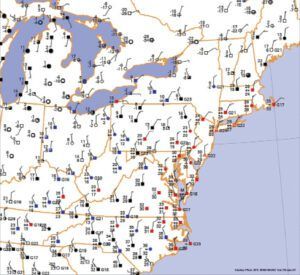
The Aviation Weather Center has better looking charts and I prefer starting there, but the Weather Prediction Center is widely considered to be the authority for surface analysis within the federal government. It gives you the locations of the fronts. Outside North America, use a search engine and look for the NOAA Unified Surface Analysis, or check your local country’s weather agency to see if they have a surface analysis.
The figure above shows a surface chart during the winter storm of January 28-29, 2022. This plot is created by the Digital Atmosphere software package and is very similar to the ones available at the Aviation Weather Center website. You’ll notice that the station plots are colored differently: some are red, some are blue, and others are black. This is a color coding scheme that became common during the 1990s. Red indicates IFR conditions, blue indicates MVFR, and black shows VFR conditions. You’re also given temperature, dewpoint, weather, a wind plot, and the wind gust if one is reported.
We see an extensive area of northerly winds. This should clue you in that the region is under an area of cold air advection. When we talk about advection, we’re usually referring to low-level or mid-level temperature advection. In this case, it’s air at the surface. When we replace the lower portion of the atmosphere with cold air, we tilt the balance of temperature in the vertical toward a “warm over cold” scenario. If you refer to ground school basics, you’ll know that this is a stable situation.
So why are we seeing poor flying weather in this area? Consider what we do know. Cold air is pouring in from the north, but this is actually occurring in a relatively shallow layer. Fresh polar air masses immediately behind a frontal system are rarely more than several thousand feet deep. So only the layer near the surface is stable, and we don’t know what’s happening aloft without getting more charts.
Here, I’ll give you the answer. The East Coast is being affected by a circulation known as the cold conveyor belt, or CCB. You might recognize this as the “wraparound” seen on radar or satellite, which helps form the comma head in the cyclonic flow north and west of surface lows. It transports moisture, clouds, and relatively warm air through the middle troposphere, at a height of around 5000 to 10,000 feet MSL.
As you might guess, this air is not the frigid air pouring in at the low levels (where cold advection is usually strongest), but is a sort of intermediate air mass that’s just warm enough to form a “cap” above the cold polar air, completing the warm-over-cold scenario. Astute readers might realize that this also forms a frontal inversion that overlies the East Coast. This intermediate air mass has moisture, partly from interaction with the warm conveyor belt, which we’ll talk about shortly.
Regardless of what’s happening in the low levels, the air in the cold conveyor belt has a strong tendency to undergo dynamic lift, which helps form bands of precipitation, usually rooted at about 5000 to 10,000 feet MSL. That means extensive nimbostratus.
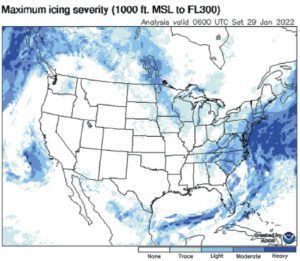
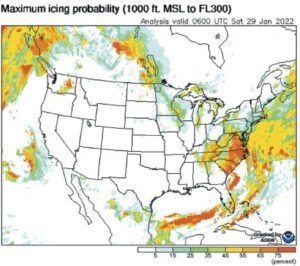
It follows that if there’s enough moisture, and enough warmth, this cold conveyor belt can create a potent zone for icing (bottom image on previous page). Large supercooled liquid drops, which are responsible for heavy icing, are most favored when temperatures are close to freezing but not above, and where large amounts of moisture are present, particularly if this moisture is constantly replenished by an existing supply. The cold conveyor belt provides this supply by continually infusing the air with more and more moisture.
East of the surface low, we find the warm front and the warm conveyor belt (WCB). As the freezing level is much higher here, the icing is easier to avoid, but you still need to keep tabs on what’s going on at the surface as there can be a lot of cold air in the low levels. In really cold situations during the depths of winter, the entire environment can be chilled enough to where you might only find a narrow band of above-freezing air near 5000 or 10,000 feet MSL, if that.
The intense warm air advection here puts you right in the core of the moisture supply. So if the atmosphere is sufficiently chilled and you can’t find an altitude where the air is above freezing, the warm conveyor belt is probably about the single worst place to be. The warm conveyor belt tends to be convectively unstable, so cumuliform clouds are common and you’ll find stratocumulus and nimbostratus with lots of embedded cumulonimbus, along with showery precipitation types.
You can search for more information about the conveyor belts. Some might be quite technical, but the National Weather Service, some universities, and some enterprising hobbyists have webpages on the topic that will distill the details.
Other Problems
What about ceilings and visibility? Here again we return to the basics that you’ll find in publications such as Aviation Weather by the FAA. Fog and stratus are favored in humid, shallow, stable layers. Obviously radiation fog is not going to be a concern in an active winter weather system, but advection and precipitation fog are quite common.
Advection fog is the primary hazard you’re going to encounter, and it occurs when warm, very moist air moves over cold terrain where a receding polar high has kept temperatures down. This cold environment chills the air to its dewpoint, and fog quickly forms. Naturally you’ll find this just north of (ahead of) the warm front. After the warm front has passed, the stable layer is gone and the air favors wind gusts and mixing, and this usually disperses the fog unless there’s precipitation.
Fog is not normally found west of (behind) the cold front. Although cold air advection does produce a stable warm-over-cold profile, topped by the frontal inversion, this area tends to have a strong pressure gradient, raising the wind speed and making it difficult for fog to form. More importantly, the cold air is usually infused by lots of warmth from the ground, creating cool thermals and adding gusts to the mix. This is not conducive to fog—in fact visibility west of the cold front is usually good.
But if precipitation forms in these areas, usually as the result of conveyor belt interactions, visibilities and ceilings can temporarily get rather low. And the stable layer near the top of the cold air, below the frontal inversion, can produce extensive layers of stratus and stratocumulus. This too can keep ceilings low until enough dry air has flowed into the area.
Tim Vasquez served as an Air Force meteorologist for the F-117A program in Nevada and the B-1B fleet at Dyess AFB. He also was a lead forecaster at the U.S. Forces Korea forecast center in Seoul. Find his tutorials at Forecast Lab on YouTube and his books at weathergraphics.com.


