
An excellent article by editor Frank Bowlin on ILS technique appeared in the February issue. A small error led to some confusion, and IFR embarked on a quest for accuracy. That quest got stymied with some faulty background. We thank astute readers for returning us to the righteous path. I’ll now clear away all confusion and help you understand in great detail which way the wind shifts, and why.
Definitions
When talking about wind shear, it’s important to be thoroughly familiar with the terms “veering” and “backing”. Veering is a clockwise change in the wind direction, normally in terms of increasing height or with time. Good practice is to carefully qualify all measures of veering to avoid confusion. For example if the winds are from the south at the surface and from the west aloft, that’s described as a wind profile that “veers with height.”
Likewise, if the ATIS says the surface winds are out of the south at 1800Z and then an hour later they’re out of the west, we can say the wind veered with time during the last hour. Backing is the opposite of veering. A good memory aid for backing is to think of the clock running backward.
Normally when forecasters hear about veering, they think about the thermal wind relationship. Take an imaginary layer of air in the atmosphere roughly 100 miles in diameter and about 10,000 feet thick. If there is temperature advection occurring in this layer, the thermal wind equation dictates that this will result in backing or veering with height. What’s temperature advection? If you’re riding along in a hot air balloon at any level in this layer and look upstream and downstream at your altitude, the temperature will be different, and winds are moving a different temperature value to a different location.
If the winds are bringing warm air into the layer, the thermal wind equations dictate that the winds will veer with height. But if cold advection is occurring, the winds will back with height. How might this appear to a pilot? Here’s a real life example: as I type this, Wisconsin is north of a warm front and is in a warm advection pattern, and I see lots of IFR and MVFR ceilings. As expected the winds are out of the southeast at the surface, veering to southwest at 10,000 feet and westerly at 30,000 feet.
Friction Comes To the Party
Now we’ll talk about an entirely different type of veering and backing: friction occurring within the lowest few thousand feet of the atmosphere. At these levels objects on the earth’s surface—terrain, treetops, billboards, doghouses, grasslands, etc.— cause friction with the wind. Overall, friction acts opposite to the wind direction. Let’s consider imaginary “parcels” of air representing the wind. Normally the wind enjoys a delicate balance between pressure gradient force, acting to the left of parcel motion in the northern hemisphere (NH), and Coriolis force, acting to the right. Coriolis force is dependent on latitude and more importantly, on the wind velocity.
When we suddenly throw friction into the mix, the air decelerates to, say, 50 to 75 per cent of its original velocity. The Coriolis force slacks off and the wind backs with time, since with Coriolis force relaxing the parcel is now able to turn left (NH) and travel more directly into nearby low pressure areas. Friction normally only affects the lowest few hundred to several thousand feet, so if we compare this backed wind to the free atmosphere above, which is still in balance, we would see that it veers with increasing height, or in other words, it backs with decreasing height. So far, so good, right?
It should be emphasized that the backing effects are not overwhelming. A long-standing rule of thumb holds that winds over the ocean, which has a low friction coefficient, will blow about 10 degrees to the left of weather map isobars, while over land, it increases to about 30-40 degrees and in mountainous terrain 40 degrees. So the change in the angle is only about 20 to 30 degrees at best.
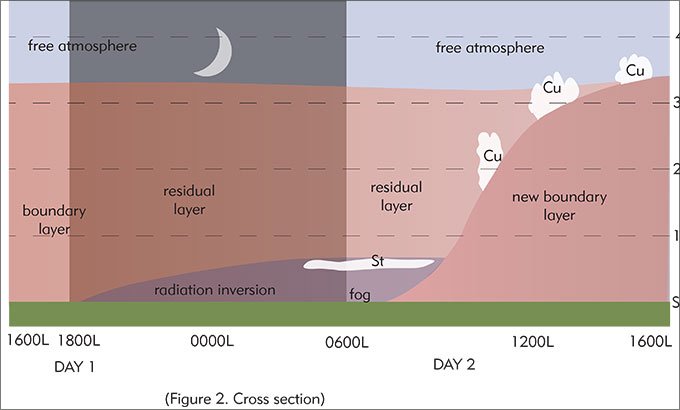
This backing is confined to a layer in the atmosphere known as the planetary boundary layer, or just simply the boundary layer. This layer is always attached to the ground. Pilots should note that it’s shallowest in the early morning and in highly stratified weather patterns (like north of warm fronts), where it may have a depth of zero to a few hundred feet, and is deepest anytime there is sunshine or strong heating, in which case it may grow to 5,000 or 10,000 feet in depth or more.
Friction gradually increases as we approach the ground in the boundary layer, and this means that the backing due to friction is spread throughout this layer. We can assume that near the ground we are getting the full effect of 30-40 degrees of turning, while at the top of the boundary layer there is only a small amount of turning, if any. But turbulence and mixing disturb this orderly model.
Stirring the Pot
The typical temperature rise in the morning, caused by the sun’s short-wave radiation reaching the ground, heats the ground and causes thermals. And it doesn’t take intense solar heating to get thermals—air at the ground a mere 0.005 degrees warmer than the air one foot above is sufficient to seed a thermal. On very small scales this is basic molecular convection, but as we get into scales of tens and hundreds of feet, these convection cells aggregate into thermals. They may be benign and can stratify if there is weak heating, but intense heating can produce massive thermals that reach tens of thousands of feet, keeping glider pilots happy. As heating goes on during the morning, the thermals get larger and more organized and the boundary layer deepens as shown in the drawing above
This heating produces a chaotic churning of the boundary layer known as mixing. It produces turbulence and eddies at scales of tens and hundreds of feet, which in turn adds randomness to the wind. If you’ve ever tried to wrestle with a kite, you can see this effect: the kite wants to go here, then it wants to go there, and in spite of your best efforts to keep it pointed the right way, you’re suddenly fighting like Charlie Brown to keep it out of the power lines.
When we see a single value for wind direction and speed, it’s easy to forget that the wind is constantly chaotic; winds normally vary by about 20 to 40 degrees in mere seconds, more when it’s unstable and less when it’s stable. This variability is what keeps pilots making all those small corrections on final approach. Weather observations use averaging, typically a 2-minute or 10-minute average, to minimize these effects. The expected veering or backing due to friction tends to be overwhelmed by these second-to-second shifts in the wind direction.
Putting It All Together
Let’s review how this affects the pilot. Let’s take editor Bowlin’s scenario: you’ve got a 10-knot headwind directly on the nose. What should you expect? If there is a deep boundary layer, the winds are indeed likely to back very gradually by up to about 30 degrees as you descend, but this may be spread out through hundreds or thousands of feet. If you have a headwind, you’ll be pushed slightly to the right of your course, but this would be “on average.” Turbulent flow and mixing may produce unexpected results, like a kite that bobs around then decides it wants a closer look at the power lines.
But while some backing with descent into the boundary layer can be expected, it is also shaped by the thermal wind relationships: if strong cold advection is in progress, the expected veering with height (backing as you descend) will be negated by backing with height. And small-scale pressure distributions in the atmosphere adds randomness.
I regularly work with hodographs, plots of wind vectors with height, and we see all sorts of shapes, especially in the 0-1 km layer which is critical to tornado forecasting. If we had a good handle on this at all times, we would probably quadruple the accuracy of tornado watches. It’s never clear exactly what the hodograph shape is going to look like.
So while the underlying theory tells us what we should see, about the only thing we can say for certain is that in most cases the winds are likely to decrease and likely to back as you descend through the boundary layer. There are a lot of other considerations at stake. While it’s difficult to predict such changes within a layer, pilots can accurately anticipate changes between two layers. When you transition from one air mass to another, you will see a wind shift at that level, a change in the type of turbulence, and even a change in the feel of the air. For example, if it’s June and 9 a.m., we might assume we’ll be descending into an active boundary layer around 2000-3000 feet and see an increase in turbulence, a decrease in visibility, and winds backing a little as described above.
Tim Vasquez, a career meteorologist, operates www.weathergraphics.com in Norman, Oklahoma. He hopes someday to have the opportunity to complete a dream and learn to fly.


Nice, short, clear, the article. One important note (technicalities), always refer to the type of units you are working with, very important if you are conducting international ops, i.e. the European theater, so when you refer “a mere 0,005 degrees warmer”… ºC or F???
Just a detail.
Keep up the good work!!
Paulo Castro
Airline Capt. (Ret)