
Strong thunderstorms are one of the places aviation and fear often intersect. And for good reason: severe storms have led to countless disasters, perhaps the most famous one being the Delta L-1011 crash at DFW Airport in 1985. That tragedy brought far-reaching consequences to flight training programs and ATC equipment, and led to advances in the field of meteorology.
You can read a lot about thunderstorms online and see all sorts of storm video and tornado footage on YouTube, but in this article I’ll draw on my experience as a flight forecaster, my radar and forecast training, and my decade-long foray into storm chasing, which gave me a look at things under the hood. I’ve distilled here some of the most useful fundamentals that are useful to pilots. Hopefully you’ll come away with a more detailed knowledge of what you’re up against when things are looking rough out there.
Convection
Thunderstorms are a convective-driven process. By convection, we mean kinetic motion that occurs due to buoyancy. The buoyancy, in turn, is caused by warm air from the lower levels of the atmosphere that rises into relatively cold temperatures aloft. The greater the difference between low-level temperatures and upper-level temperatures, the greater the instability, and the more likely that a buoyant parcel of air will rise rapidly. The velocity of these rising parcels, by the way, is directly correlated to in-cloud turbulence and severe weather. So instability figures alone do directly correlate with bumps and problems in the cockpit.
You might now be picturing a boiling cumulonimbus cloud. But I haven’t yet said anything about moisture. In an unstable environment with rising parcels, we could very well be talking about Phoenix or Riyadh in July under blue skies.
But, clearly we do need moisture to get storms. The more moisture that exists in terms of unit mass, the better—for the storm. The best measure for this is dewpoint, mixing ratio, or specific humidity, especially at the surface or in the lowest kilometer of the atmosphere. Dewpoint works perfectly fine for this purpose, and it’s available on the ATIS broadcast. Higher dewpoint favors thunderstorms and severe weather. But this doesn’t always work.
Warm mid-tropospheric conditions are usually what shuts down any storms when it’s sultry outside. This explains the so-called “horse latitudes,” in subtropical regions, where warm moist air lingers for months but the rain never comes. And that’s because of warm middle and upper tropospheric conditions caused by the subtropical ridge. No wonder the deserts of Australia, northern Africa, and the Middle East are so dry.
You might already be thinking that if we could just compare the low-level temperatures to the upper-level temperatures, and compare the dewpoints, we could work up some sort of rule of thumb for predicting storms. The K Index and Totals Index do this very thing, and were popular in the 1960s and 1970s. Refinements known as Showalter Stability Index and Lifted Index had the same idea. However all of these just look at single levels in the atmosphere, meaning important details can be easily missed. Those techniques are now considered antiquated and not very accurate.
Around 2000, the meteorological community embraced a quantity called CAPE (convective availability of potential energy), expressed in joules per kilogram. CAPE does the same sort of thing by looking at temperature differences and factoring in dewpoint, but it integrates all levels in the atmosphere and gives a more realistic picture of instability. It’s probably the single best predictor of storm potential. You can find CAPE on many products across the Internet. Values of above zero indicate instability exists in the atmosphere, with values over 400-500 supporting storms, and those over 1000-1500 supporting severe weather.
However you must be careful how it’s used. For example, many atmospheric soundings found on the Internet show you CAPE numbers, but these soundings are valid only at the radiosonde launch time, which is 0000 and 1200 UTC at most locations. They don’t factor in changes like diurnal heating and moisture advection that could affect the environment during the day. For those you must either get an updated sounding or use a model forecast sounding. The Storm Prediction Center mesoanalysis graphics at www.spc.noaa.gov/exper/mesoanalysis/ are better for beginners and will give you easy-to-read maps of current estimated CAPE numbers, as well as forecast CAPE out to 6 hours in the future.
Storm Structure
Now let’s take a look at the storm itself. The rising updraft is caused by sensible heat and latent heat interacting with the instability in the atmosphere and producing large masses of buoyant air. It’s fed from below by inflow, made up of warm moist air. It rises in the updraft, condenses, and produces cumuliform cloud material, giving us the familiar cumulonimbus towers. Eventually precipitation is formed: a mix of ice crystals, droplets, and graupel.
The air at the top of the updraft eventually reaches an equilibrium level, where it encounters the tropopause or layers of relatively warm air. At this point the updraft spreads into a vast anvil cloud made up of ice crystals. Some of it is carried hundreds of miles downstream.
But the precipitation begins falling, and entraining the surrounding air. This leads to the development of a downdraft. Many downdrafts are weak, but relatively dry air surrounding the mid-levels of storm can help accelerate the downdraft and lead to downburst and microburst production. Low dewpoints and low relative humidity in the middle troposphere, in a band between 10,000 and 25,000 feet MSL, are a prime contributor to these dangerous events. A special kind of CAPE expression called DCAPE (downdraft CAPE) is extremely helpful for identifying these environments. Values over 1000 strongly correlate with downbursts and microbursts.
Once the downdraft reaches the ground, it spreads horizontally in the form of outflow. This in turn can produce a large, menacing arcus cloud, and spread away many miles as an outflow boundary. If the outflow boundary is strong and gets more than several miles from the storm, the storm itself normally begins weakening and dissipating, but new storm development can take place along the outflow boundary.
Shear
Perhaps you’ve wondered why the tropics have such massive storms, yet tornadoes are almost unheard of in those regions. The reason for this is these tropical areas usually lack vertical shear and helicity.
Vertical shear is simply the change in the wind vector per unit of height. Naturally, strong winds with large directional changes are most effective at providing vertical shear. In the tropics, pressure gradients on a day-to-day basis are simply not strong enough to produce strong, sustained winds through deep layers.
Forecasters most commonly look at the difference between low-level and upper-level winds to give a spot estimate of shear. This is known as bulk shear. The 0-6 km (0 to 20,000 feet) shear is often seen in publications and scientific papers, and is simply the wind vector difference between those two levels in meters per second or knots. To a certain extent you can even eyeball it looking at winds aloft charts. Bulk shear is one of the best discriminators of severe storms, and values that exceed 30 knots favor organized storms like supercells and bow echoes. Perhaps now you’re seeing why jet streams and severe weather have something in common.
Then there’s helicity. This measures both the shear and the directional change of the winds through a vertical layer. Here, the lowest one or two km is by far the most important layer. This represents the layer that becomes ingested into a storm updraft. Helicity leads to a tendency for a corkscrewing motion of the air.
Imagine that you lay a pencil in your hand, pointed away from you to represent the mean wind vector. You move your lower hand slowly away from you and push your upper hand rapidly away, repressing the differing wind flow at two levels. This is shear with no helicity or directional change. The pencil does not rotate, because the shear is parallel with the pencil. But if you push your lower hand away and to the left, and push your upper hand away and toward the right, the pencil rotates between your hands, simulating the corkscrewing tendency of this air.
 If this layer is tilted into the vertical by the updraft, the helicity is converted to vertical vorticity. This shapes the distribution of mass in the storm in a way that creates mesocyclones and tornadoes. Exactly how that happens is still not well understood and you’ll have to dig around in meteorology journals. But this helicity helps the storm become steady-state, adding to its persistence. All of this helps create the supercell thunderstorm. Shear and helicity translate to supercells and tornadoes. And you don’t need much instability to make it happen. Tornado warnings during hurricanes are a good example.
Thunderstorm Features
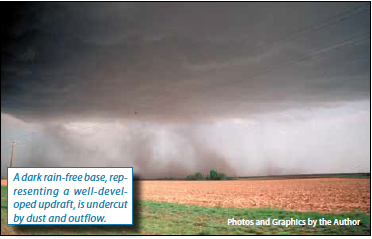
Now that we’ve gotten past the boring fundamentals, let’s examine the storm the way you see it from the cockpit: in terms of visual features. The cumuliform tower itself is a manifestation of the updraft, and on its bottom side is a so-called rain-free base. A broad, dark rain free base signals the presence of a large updraft and the potential for further storm organization. A mushy, ragged updraft base indicates a weak updraft, and sometimes the rain-free base paradoxically fills up with rain, becoming fuzzy, and telling you that the updraft has just given up.
If you’re at a distance from the storm, you can examine how hard the tops of the cumulonimbus towers look. Rock hard, cauliflower-like towers suggest the updraft is rising rapidly in an unstable environment. Knuckle-like textures near the interface with the anvil, and overshooting tops punching a few thousand feet above the anvil are also signs of a strong storm. On the other hand, mushy towers with soft tops suggest a weak storm.
The precipitation core is another important part of the storm, and takes on a diffuse, foggy, whitish appearance. Sometimes the boundary between the updraft and the precipitation shaft is unclear, but they do represent two different processes. The precipitation shaft is made up of a mix of falling rain, hail, and graupel, and it tends to be embedded in the downdraft. This is what you see on radar, not the updraft or the cumulonimbus towers.
Pay close attention to wind direction. Is it flowing towards or away from the precipitation core? This determines whether you’re getting outflow or inflow. Which one is happening directly underneath the rain-free base (the updraft) tells a lot about whether the storm is outflow dominant or not. If winds under the rain-free base seem to indicate extensive outflow, there’s a possibility the storm is being undercut and will either weaken, dissipate, or redevelop (propagate) further downwind.
And look at the ground all around the storm. Sometimes you can see dust whirls or dusty plumes, indicating the presence of strong winds. This can help show where the outflow is, but in rare instances it’s the result of strong inflow, especially in severe weather episodes in the Great Plains. Tracking the movement will help give some idea of what you’re looking at.
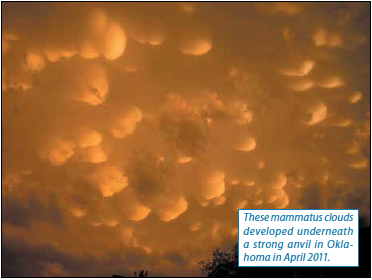
Often you will see mammatus, which are rounded bumps on the underside of the anvil cloud that look like udders. Flight training material from the 1970s used to refer to this as a sign of tornadoes and severe weather, but this is now known to be a myth. Mammatus does tend to correlate with well-developed thunderstorms producing large amounts of ice crystals and probably an environment with moderate shear, but it sometimes also develops in benign weather conditions. Enjoy the view and take a few pictures if you can.
Then there’s lightning activity. Yes, if you have a Strikefinder you can use that too. Lightning frequency definitely correlates with storm strength. A distinct sign of strong storms are “anvil crawlers,” which are horizontal lightning discharges that appear as fingers reaching outward or which snake through the anvil for many miles. I’ve always associated these with hailstorms, and they’re common in tornadic storms. I’m not sure I’ve ever observed these with a non-severe storm.
Forecasting the Storms
Storm forecasting is complex, and probably a bit too specialized for the general aviation community. But I’ve introduced you to the essentials: instability, shear, and helicity are the key things we rely on. Quite often when I forecast, I’m keeping it simple and just focusing on CAPE and a few shear values. Tracking boundaries, fronts, and changes in the atmosphere and using the most of satellite, radar, and surface plots is perhaps 80 percent of the work. We use forecast models surprisingly very little when forecast time scales are minutes to a few hours away. They just don’t work well.
One source you should get to know is SPC, the Storm Prediction Center (www.spc.noaa.gov). The convective outlooks are the best products there are for finding hazardous thunderstorms, and I would argue that SPC employs the best storm forecasters in the country. When you are down to the one- to two-hour time frame, start checking the Mesoscale Discussions tab. This outlines areas of concern before most watch boxes are issued, and they contain a convenient map and discussion.
And check close-up visible satellite images and radar regularly. As you get used to working with these products, you’ll become accustomed to how a storm situation looks and will soon be able to spot important features. Definitely continue to use your authorized briefing sources, but having a few bookmarks on hand will help fill in some of the unknowns and provide you a greater depth of situational awareness on your next flight.


