
The Terminal Aerodrome Forecast, TAF, is a staple of aviation weather, known to almost every pilot. During my own Air Force career, I composed hundreds of TAFs for pilots not too different from you. In this article we’ll take an inside look at this tool in a more readable format than you’re probably used to. Though we’ve touched a bit on the TAF in the past, it’s time to give this trusty planning tool an exclusive article.
The story of TAF code goes back to the Convention on International Civil Aviation, held at the Stevens Hotel in Chicago in December 1944. Members from 52 nations set out an ambitious postwar plan for international cooperation in aviation, which included standardizing coded messages. The TAF format was proposed, but unfortunately it was slow to gain acceptance, and for another 20 years countries continued to use what worked for their customers.
It was January 1968 when the world finally came together and implemented TAF as a data-exchange standard. This final push towards global standardization grew from the rapid growth of digital communication networks and the dramatic surge in commercial aviation. The United States was slowest to adopt TAF, using it sparingly for its large international airports and military bases. Elsewhere the U.S. continued using the old terminal forecast format, FT, which was based on the old aero code. These FT forecasts hung around until 1995 when they were finally phased out. A lot of our older readers probably remember FT code better than TAF code.
A Sample TAF
As we discuss TAFs, we’ll refer to this example pulled from the Aviation Weather Center website at aviationweather.gov, which is a great source to get the data. You may already know how to decode this example, but read on and I guarantee you’ll pick up
some new information.
Location identifier
Our TAF starts out with the location identifier, KIWD, more properly the “ICAO indicator,” a four-letter code that shows the location of the forecast. In this case KIWD is Gogebic-Iron County Airport in Ironwood, Michigan. United States TAFs are valid at the airport and five statute miles around it, while the 5–10-mile range is a donut-shaped area officially considered to be the “vicinity” of this location.
Location identifiers in the United States are officially published in a document known as FAA Order 7350.9, Location Identifiers. Since the 1960s this 10-pound document has served as a sort of phone book in forecast offices, documenting everything from LAX Airport to the smallest dusty airstrip, but it also includes navaids, fixes, and Canadian and Mexican identifiers. It’s now available as a free PDF download. A better way to search this vast document is to just visit the FAA’s Location Identifiers Search Tool engine. You can also visit sites like Airnav, which aren’t official listings but are built on databases from the FAA’s National Flight Data Center.
Technically, the FAA only maintains a system of three-letter identifiers. To get the ICAO form, the FAA instructs us to put a “K” before the identifier in the Lower-48 states. Alaska and Hawaii have a system of separate ICAO identifiers that begin with “P” and you’ll need to make sure you have those sorted out before taking your airplane up north for the ultimate hunting or fishing trip.
If your flying takes you overseas, you’ll need to turn to ICAO Doc 7910, Location Indicators, issued four times a year. Here’s where things get troublesome: This document is not free. In fact it costs $245 for a PDF download. Fortunately there are listings of the data on the Internet, including sites like Wikipedia, though they’re not always up to date.
But most briefing services have a copy of the document if you need information from it. It should also be said that the ICAO is not an identifier assignment authority, but simply republishes information coming from each nation’s official Aeronautical Information Publication. So Doc 7910 is not something you need, but it’s nice to be able to reference.
Time Group
All TAFs start with a date and time group, expressed in Universal Coordinated Time (UTC), also known as Zulu time from the old phonetic military time system, hence the “Z.” The time is given as ddhhmm, where dd is the date, hh is the hour, and mm is the minute. In our example we see the time is “142320Z.” This means the forecast was issued on the 14th of the month at 23:20 UTC.
The time group may not seem like much, but you should get into a habit of checking this whenever using a TAF, as sometimes old forecasts have a way of sneaking into your workflow. An old browser cache is one way this can happen.
Valid Time
The next block of data is the valid time, which tells us the range of time the entire forecast covers. This is given as a ddhh/ddhh group, where the first group is the beginning date and hour, and the second group is the ending date and hour. In the United States these typically span 24 hours with some international airports forecasting 30 hours. Outside this range, you can’t reliably use the TAF and will need to wait for a later bulletin or talk to a briefer.
In our example, “1500/1524” tells us that the forecast spans the entire day of the 15th. This is only a 24 hour forecast.
Wind Data
Our next block of data gives us the wind. This is provided in the form dddffKT or dddffGggKT, where ddd is the direction in degrees, ff is the sustained wind speed in knots, and gg is the wind gust. Direction in METAR and TAF reports are always relative to true north. When talking to the tower, remember that you will get a magnetic direction from them instead.
If you’re accustomed to METAR observations, you know that the wind speed is a two-minute average at observation time in the U.S., while the gust represents the maximum wind observed over the previous 10 minutes. But the TAF is slightly different as it’s written to express a wind that is representative across the entire time group.
If the wind speed is seven knots or greater, the forecaster is obligated to provide a direction. But if the speed is below that figure and a prevailing surface wind cannot be determined, the forecaster will use VRB for the direction. Calm winds will always appear as “00000KT.”
If you’re flying overseas, especially in the former Eastern Bloc, you will often see “MPS” instead of “KT.” This is wind expressed in meters per second. A quick rule of thumb is to multiply by 2 to get knots (the exact factor is 1.94).
Prevailing Visibility
Prevailing visibility, by definition, is the maximum visibility that exists across at least half of the horizon. Visibility, of course, is the greatest distance at which an object can be seen and identified. Simple enough; we just need to know which units to use.
U.S. TAFs express prevailing visibility in statute miles, adding “SM” as a friendly reminder. Overseas TAFs carry no such reminder, a tip that they’re using meters, expressed as whole 4-digit numbers. A quick rule of thumb forecasters use is 1600 meters equals one mile. Now you can convert back and forth with ease—“4800” is the same as “3SM.”
Visibilities greater than six miles cannot be reported in a TAF, so when you see “P6SM” that means visibility ranges from “good” to “clear as a bell.” The equivalent of this overseas is “9999” for unlimited visibility.
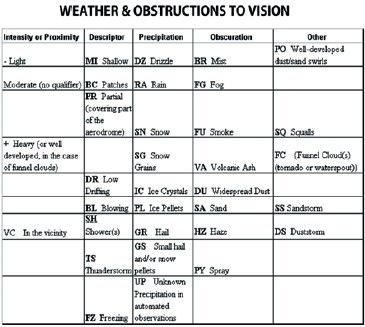
Weather Type
Anytime weather or an obstruction to vision is present, the forecaster must specify it immediately after the visibility. You may be well familiar with these codes already; such as the SHRA in our example which indicates rain showers. A complete code listing is shown on the previous page.
One code that may be seen on the TAF but not in METAR reports is VC, “vicinity.” This is used for fog, thunderstorms, or showers. You can assume the forecaster believes there is at least a 50 percent chance of the phenomena occurring in the vicinity of the station and it will be present for at least half the time period.
Sky Condition
Sky condition is handled much like in the METAR report. In our example, BKN045 indicates that there is 5/8ths to 7/8ths cloud cover at 4500 feet. This altitude is always above ground level (AGL), using the airport as a reference height, and is listed in hundreds of feet. Cloud types are never given, with the exception of CB, for cumulonimbus, which will be suffixed to the layer height.
If multiple cloud layers are present, keep in mind each layer is always specified as the sum of that layer’s coverage plus all layers below it, as seen from the ground. If we add a small patch of cirrus to the sky condition above, we will get BKN045 BKN250, but this dramatically overestimates the amount of cirrus actually present. So the TAF does not work well for summarizing all the layers you’ll see at cruise altitude, but is meant strictly to provide a picture of how the sky will look from the runway. For higher clouds, the AWC Graphic Area Forecast (GFA) and satellite images will help complete the picture.
Cloud layers are predicted by the forecaster based on the current METAR observations, on the Skew-T diagram, and on forecast trends. With thunderstorms, forecasters generally go by a guess of typical conditions in thunderstorms, based from the lifted condensation level, which in turn is a function of relative humidity. It’s a good idea to always look for the potential for actual ceilings to go much lower, especially where intense precipitation limits the vertical visibility or where rain-cooled air is forced to ascend. These processes can’t always be forecast well.
In the worst weather you will sometimes see VV instead of a layer amount group. This is vertical visibility, which is used when weather or an obstruction to vision restricts the visibility. This value
effectively provides the ceiling height.
FM and TEMPO
It would sure make life simple if the weather at your destination stayed exactly the same for the duration of the TAF. But that’s rarely the case. To accommodate transitions in the weather, meteorologists divide the forecast into blocks of time and separate them using
the FM, or “from” marker.
This has the form FMddhhmm, where dd, hh, and mm are the day, hour, and minute that begin the next forecast block. The old forecast block is discarded and the new forecast information takes effect until we reach the next FM marker.
TEMPO is another marker that might be seen, which indicates a “temporary fluctuation” in the current forecast block. A TEMPO group is used when there is a high likelihood (over 50 percent) of the conditions occurring, and which also lasts less than an hour. The format used here is TEMPO ddhh/ ddhh, where the first ddhh group is the date and hour for the beginning of the fluctuation, and the next group is when it ends.
PROB, “probability” is another marker. It is encoded just like TEMPO except that a percentage probability is appended to the PROB marker. The forecaster can only use a PROB group past the first eight hours of the forecast. The National Weather Service only uses PROB30; if it’s less than that it’s deemed too unlikely, and if it’s more than that, a TEMPO group is more appropriate.
Some Odds and Ends
Some TAFs might report wind shear. In the United States, only the layer from the surface to 2000 feet AGL is considered. This is not reported in thunderstorms, since low level wind shear is always assumed to be present. The code takes on the form WShhh/dddffKT, where hhh is the top of the shear layer in hundreds of feet, ddd is the wind direction at this layer, and ff is the wind speed in knots at that height.
Some pilots confuse these numbers for wind shear gains or losses they might see on the approach, but this is a misconception. The wind data strictly gives the actual wind direction and speed reading.
Finally many international weather stations and the U.S. military encode maximum and minimum temperatures, TXtt/ddhhZ TNtt/ddhhZ, where tt is the temperature in Celsius and ddhh is the date and time the value is expected to occur. You can look for these to get an idea of density altitudes on your arrival.
Not in the U.S.
There a few code forms you will not see in the United States but could encounter frequently overseas. First is the CAVOK abbreviation, which is common in Europe. This means the prevailing visibility is at least 10 km, there is no cloud below 5000 feet or below the
highest MSA altitude, and there is no significant weather. You can remember CAVOK as Ceiling And Visibility OK.
There’s also the BECMG marker, which represents a gradual change over a period of time to a new condition, and includes a range of times for this transition. It’s similar to the outdated GRADU that old hats might remember. It’s not clear why the U.S. never adopted this form, but as Bruce Hornsby said, that’s just the way it is.
Finally some foreign weather services will encode minimum altimeter setting with a QNH prefix. Again, this is not done in the U.S.. But if you see it, it’s there for you to use.


There are several exceptions to this article that many aviators may see domestically, if they rely on a military TAF or METAR for their weather briefings. Specifically, the QNH as well as 9999. Very interesting article!