
Last month, “Handling Windshear,” described how to recognize, avoid and, handle an encounter with windshear. The focus of that article was the practical side of piloting but we necessarily touched on the basics of the weather behind thunderstorms, microbursts and windshear. Now it’s time to dig deeper into that meteorology.
Why Care?
Windshear was a major research topic in the 1980s when it was responsible for several airline crashes, culminating with the 1985 Delta L-1011 tragedy at DFW Airport. Windshear is now covered heavily in pilot training,.
The biggest danger of windshear is unexpected airspeed loss during a critical phase of flight. Windshear isn’t just linked to turbulence but actually generates it. So, there’s the potential for loss of control and airframe damage, depending on the intensity of the shear.
Another risk of windshear is that it is typically unknown: windshear occurs on such small scales that we can observe only bits and pieces of it. Even NEXRAD and TDWR just show the general setup. So you’ll need to recognize the patterns that lead to windshear to understand just how it will impact your flight.
Defining Windshear
Windshear has a fairly simple definition: a change in the wind vector through a vertical layer of the atmosphere; in other words, a wind gradient in the vertical. This is often marked by a change in wind speed. If winds are fairly strong, a change of wind direction through the layer can also cause windshear.
One definition to be aware of in windshear forecasts is “veering” and “backing,” which describe a change in direction. When wind direction changes clockwise with an increase in altitude—for example south winds at the surface and west winds at 10,000 feet—the wind is said to be veering. The wind is said to be backing when the direction change with altitude is counterclockwise.
“Backing” and “veering” are sometimes used where time replaces altitude, which can be confusing. Replace 10,000 feet in the example above with a few hours and you also have veering. In severe weather forecasting we’re always on guard for winds backing with time, which is often associated with mesolows and increases the storm-relative helicity—exactly what supercells like.
Types of Shear
Fair-weather windshear is often called non-convective windshear. It’s usually caused by an inversion, a boundary separating cooler low-level air from warm air above. Inversions strongly resist vertical motion and prevent the air masses from mixing, so pilots can encounter some rather substantial airspeed changes over a short vertical distance.
Shear from showers and thunderstorms is also common. These can generate downdrafts that reach the ground and produce outflow that diverges from the cell. This outflow is a cold pool with high density, often just several hundred feet deep. The wind within this cold pool can differ significantly from the environmental wind surrounding the storm, generating a shear zone. The character of the shear is very difficult to predict and depends on what part of the storm we’re observing. But the magnitude of the shear tends to be closely linked to storm intensity, instability, and the presence of dry air aloft. If any of these are present, you’ll want to be extra careful.
Fronts are another source of windshear. Although technically non-convective shear, when fronts are just south of your airfield, there can be shallow cold layers near the ground that resemble those from showers and thunderstorms. You won’t need to worry about microbursts, but there can still be turbulence and 10 to 20 knot airspeed losses near the ground, as well as shear that knocks you off the final approach course a bit.
Convective Windshear
Showers and thunderstorms can produce convective windshear. To understand this better, we need to take a look at storm structure and understand how thunderstorms develop. Although we’ll use terminology for thunderstorms here, convective windshear can be caused even by showery cumulus and cumulonimbus clouds, particularly in the dry weather regimes we see in the Great Basin and Rocky Mountain region. Lightning is not required. The mechanisms are all the same.
A developing cumulus cloud is produced by a rising updraft. If it strengthens further and conditions are unstable, it may grow into a cumulonimbus cloud. This cloud is fed from beneath by warm, moist inflow. Precipitation quickly begins developing in the updraft at altitudes of about 10,000 to 20, 000 feet.
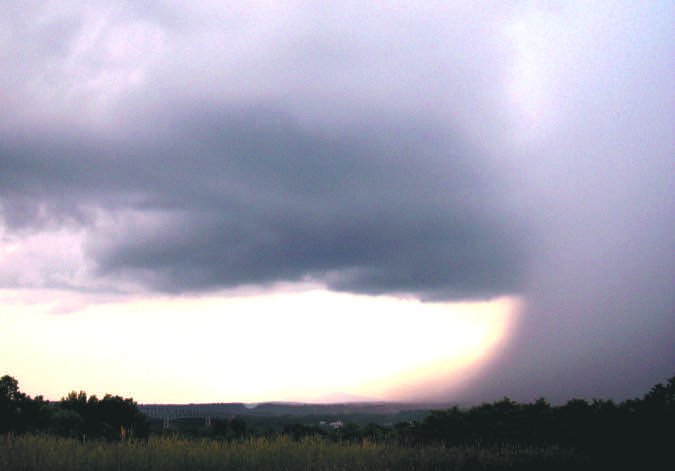
This precipitation begins raining out of the updraft and via drag forces, it sets the air around it into motion, causing it to rapidly sink. This sinking air is accelerated by evaporational cooling. All this produces a downdraft. When the downdraft reaches the surface, it spreads out in all directions, producing outflow. The outflow pool may range anywhere from hundreds of feet to a few thousand feet in depth, with very strong changes in temperature, wind speed, and wind direction along its outer and upper edges.
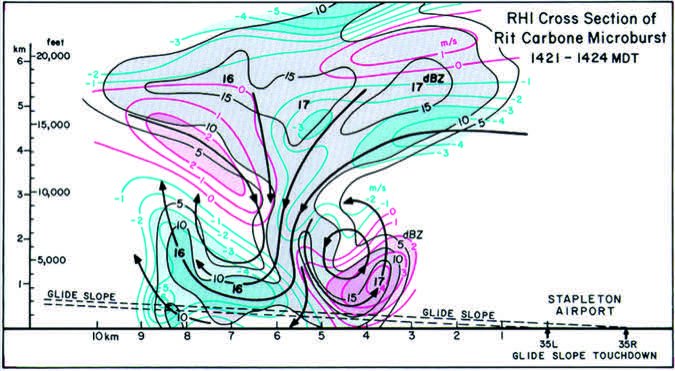
Most hazardous shear in a storm is produced by the downdraft. If it’s particularly strong, it’s called a downburst, a name coined in 1980 by the late tornado guru Theodore Fujita. Downbursts are responsible for most of the “straight-line wind” damage reports, but also can have major impacts at airfields. One downburst at Andrews Air Force Base in August 1983 calibrated anemometers recorded 130 mph winds. President Reagan’s plane had landed at the airfield only seven minutes earlier.
Forecasters use factors like instability and dry air aloft to assess the possibility of damaging downbursts. We won’t cover the techniques here but you can consult the Storm Prediction Center products. Thunderstorm hazards include tornadoes, hail, and high winds. The high-wind category is specifically a direct indicator of downburst potential.
The Legendary Microburst
A particularly strong and localized downburst is called a microburst, also named by Dr. Fujita in 1981. By definition it’s smaller than 4 KM (2 NM). This delivers a more intense, focused punch and increases the danger. There’s no point in splitting hairs between downbursts and microbursts because thunderstorms producing downbursts have the potential to generate microbursts. They can happen suddenly anywhere in or around a downdraft core. The techniques that apply to microbursts apply equally to small downbursts.
Textbooks emphasize the danger to aircraft on the approach with a small downburst or microburst core directly between the aircraft and the runway. Approaching the divergent downburst, the aircraft encounters a strong headwind. This boosts lift, and the pilot reduces power to compensate. Emerging on the other side, the aircraft enters a tailwind. Lift is reduced, and sink rate increases dramatically. If the airplane is near the ground and low on power, especially if the pilot is pointing the nose down to re-acquire the glideslope, the flight can reach a quick and tragic end.
Nonconvective LLWS
In relatively fair weather, we can get nonconvective windshear. This usually occurs in conjunction with an inversion, where the temperature remains the same or increases with height. It separates a warm air mass from a cooler air mass beneath. The inversion is important because vertical motion through it is suppressed, preventing mixing of the two layers.
These decoupled layers can each have significantly different wind regimes. The inversion itself separating them might be just a few dozen feet deep, leading to abrupt airspeed changes and possibly even a stall when an aircraft ascends or descends through them. Of course, this becomes most critical when the transition zone is a couple of thousand feet or less above the ground. This is low-level windshear (LLWS).
Inversions come from multiple sources—nocturnal cooling, dynamically-produced subsidence, and fronts are common sources. They can all produce a zone where winds change substantially. If winds in the upper layer are strong and in the lower layer are weak, the LLWS is particularly hazardous if the inversion is close to terrain.
A good rule of thumb is if winds are 40 knots or more at about 2000 feet AGL with winds near the ground 10 knots or less, LLWS can be expected. Wind direction changes of 60 degrees or more within this layer can also signal LLWS potential.
The Low-Level Jet
The low-level jet (LLJ) should be well-known to any pilot regularly flying in Texas, Oklahoma, or the adjoining states. The LLJ is a band of strong southerly winds with its core at an altitude about 4000 to 7000 feet MSL. The core often exceeds 40 knots and may approach 80 knots, and the wind veers sharply with height or increases through the inversion. The LLJ is most common during the spring and fall, but sometimes appears during the winter. Although it’s normally found in the southern Plains, on rare occasion it may appear in the Midwest, the Southeast states, and the Carolinas.
The LLJ starts with strong jet stream winds blowing perpendicular to the Rocky Mountains. This causes a lee-side trough to form in eastern Colorado and northeast New Mexico. Southerly winds develop in Texas and Oklahoma, responding to this pressure gradient. This belt of southerly winds concentrates when a storm system crosses the Rocky Mountains, enhancing upper-level divergence and causing low-level air to flow even faster from south to north.
The LLJ weakens during the day when the atmosphere is dominated by buoyant thermals, extending the influence of friction to higher altitudes. But at night, this upward motion shuts down, and nighttime cooling causes decoupling of the layers near the ground. The air only a few thousand feet off the ground is free to accelerate, and the LLJ intensity is at a maximum around dawn.
The LLJ is a notorious LLWS producer. Normally with the LLJ being so high, the bulk of the strong windshear reports and airspeed losses are a few thousand feet above the ground. But depending on the patterns, the LLJ can descend much closer to the ground, posing flight hazards.
Radar Tools for Shear
Radar data is the most helpful tool for identifying convective shear conditions. It helps establish where the hazards are. Bubble-like signatures and convex fine lines around storms identify the outflow areas. High radar intensities or storms producing prolific outflow boundaries suggest windshear hazards.
And keep in mind the limitations of the radar products (“Radar Revealed,” June 2014). Airborne radar gives you the most accurate look at downburst cores and other nearby hazards. All other radar products have latency and are not recommended for trying to weave through hazardous weather, though they’re helpful for showing the magnitude of the hazards and how to broadly avoid them.
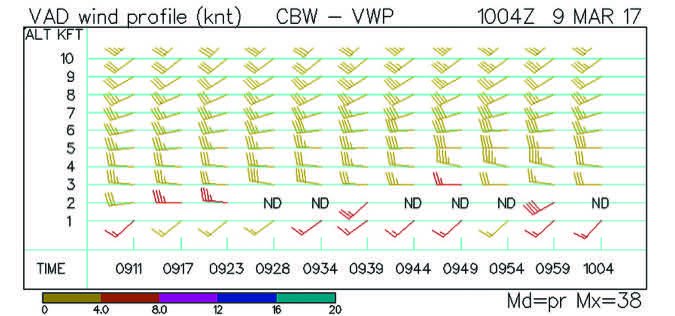
Doppler radars like NEXRAD and TDWR can directly measure winds aloft. This is very helpful for non-convective shear. For readers with access to radar packages, there’s a product called VWP (velocity wind profile), shown below. This samples the clear-air returns all around the radar at different levels. The guidelines above apply: if you see differences of 30 knots between the surface and a few thousand feet above the ground, or strong wind direction changes with any significant wind, be alert for windshear. This information is available to you even at remote locations, like Glasgow, Montana and Riverton, Wyoming; all you need is a radar site.
But be aware that when a front is moving through the area covered by the radar site, or if areas or lines of thunderstorms are in the radar coverage area, this will disrupt the VWP product since conditions will vary in different locations around the radar site. Even in such situations it’s possible to accurately estimate non-convective windshear using the velocity products, though it gets trickier and is beyond our scope here.
Other Tools to Use
Surface and upper-air observations are another tool to use for non-convective shear. You can use winds-aloft data as well as the common 925 and 850 mb charts. The 925 mb level is at about 2500 feet and the 850 mb level at roughly 5000 feet MSL, which, of course, might intersect higher terrain. However these charts are dependable, and forecast fields are readily available on the web. This can be a tremendous help if you’re ever overseas doing bush flying or cross-country flights, where experienced briefers aren’t around to help you.
For those willing to get into the hardcore weather data, check out soundings and skew-T charts on sites like College of DuPage Weather and UCAR. These will give you a very detailed look at low-level winds as observed by the balloon launches. Specialized programs like RAOB, often used by glider enthusiasts, give the most detailed look.
And most of all, don’t forget your comrades in the air. Check for PIREPs and ask ATC for reports when the opportunity arises. And send those PIREPs yourself once you’re in the air. There are more people depending on them than you might suspect.
Staying Safe
Convective windshear can be avoided by simply avoiding storms and not attempting landings and takeoffs in thunderstorms. A recurring theme in NTSB reports covering GA and Part 135 crashes is loss of control immediately after takeoff, or on final approach, when our radar post-mortem has clearly shown that waiting 10 or 15 minutes would have made all the difference. Patience can literally save your life.
Monitor the TAF not only at your arrival airport but surrounding airports. Even if the forecaster is not expecting any problems for your arrival, LLWS reports nearby should get your attention.
And of course, check the turbulence at aviationweather.gov, which identifies both convective and LLWS hazards. The forecast guidance on that site has gotten remarkably good at identifying hazards, and continues to improve.
So, there you have the short course on windshear. Understand your hazards thoroughly, plan carefully, and be patient when shear is in the area, and you’ll make it safely past those unexpected wind-vector changes.
Tim Vasquez is a professional meteorologist in Palestine, Texas. See his web page and his various materials at www.weathergraphics.com.


