
Walk into any flight operation and they’ll tell you that safety is the top priority. As of 2016, accident rates across the board from GA to commercial operations have fallen to an all-time low. This is thanks to the cooperative efforts of pilots, controllers, technicians, instructors, and the organizations that support them.
Given the great improvements in safety and the stringent standards that apply to everything from replacement of a torque link bolt to the handoff of an aircraft by ATC, it might seem strange that we’re approaching the year 2020 and busted TAFs (Terminal Aerodrome Forecasts) are still a fact of life. This is not due to any failure by the National Weather Service or the FAA, but is a reflection of the limitations of our ability to properly sample the atmosphere and resolve processes at the smallest scales. Forecasting, even in 2017, still remains a blend of science with human intuition and experience, and will likely remain so for some time.
Tim Vasquez
This uncertainty is why weather remains one of the most challenging areas of aviation, one that you should study as much as possible. Make sure you’re familiar with Chapter 7 Section 1 of the AIM. Supplement that with other FAA documents and these Wx Smarts articles to get a better understanding of the weather and what forecasters might be thinking. The more you know about the nuts and bolts, the more insight you will have, and that will help you make the correct decisions when you’re bouncing around in the soup and your destination goes below minimums without a forecast.
What Busts Forecasts
To understand why a forecast might be way off, we need to have a better understanding of how TAFs are put together. They’re composed by an aviation forecaster at the National Weather Service, who is responsible for a small section of the United States measuring about 200 miles in all directions. Each office is responsible for maintaining about 10 TAFs, which are constructed using observed weather and numerical guidance plus the forecaster’s experience and intuition and a mix of chart analysis, pattern recognition, and climatology knowledge.
That numerical guidance comes from deterministic forecasting models. Some of the most commonly used aviation models are the RAP (Rapid Refresh), HRRR (High Resolution Rapid Refresh model), and NAM (North American Model). The NAM is actually the formal title for NOAA’s implementation of the WRF (Weather Research & Forecasting model). Finally the GFS (Global Forecast System) is rarely used for TAFs but mostly for the international wind forecast panels familiar to pilots heading for Asia and Europe. It’s actually possible to run all of these models on today’s home computers, but the official ones are centrally run by NOAA to maximize the quantity and quality of the input data and solve any problems with the model run, often referred to as blowups.
These models start with a combination of gridded data from previous models, called first-guess fields. This first-guess field is adjusted with observed data that includes METARs, SYNOP observations, ship reports, radiosonde observations, radar data, satellite cloud tracking over oceans, and many more sources. All of these are aggregated into a system called the GDAS (Global Data Assimilation System), which can be fed to all the different models.
This assimilation is an art form in itself; do you initialize the model more heavily with the dependable and stable first-guess field, or do you weight it more heavily with the observed data? You might be tempted to rely on the latter, but it’s very difficult to balance the mathematical fields constructed entirely with raw observational data. It’s sort of like using 8 dots to outline an ellipse and connecting the dots. The picture you get is technically correct but requires more work to get it into a usable form.
Once we have our properly balanced 3-D grid of weather across North America or the globe, called the initial condition, we apply equations of motion to predict changes at each grid point. We’re solving how temperature, wind, mass, and humidity change at each grid point. We advance forward in time a few minutes, solve the equations again, and so on. Once the model has advanced to each desired hour, such as 12 hours, we can write the grid data out to a file and draw maps of what it shows at that forecast time.
Finishing the Forecast
It would be easy to write software to produce TAFs based strictly on model data, but I’ve never seen such a thing in my 27-year career. Models fields tend to be noisy, especially during the first couple of hours when the model “spins up.” Also the fields are not handled very well next to mountains and shorelines where values change rapidly over a short distance. Finally the models don’t offer very good vertical resolution.
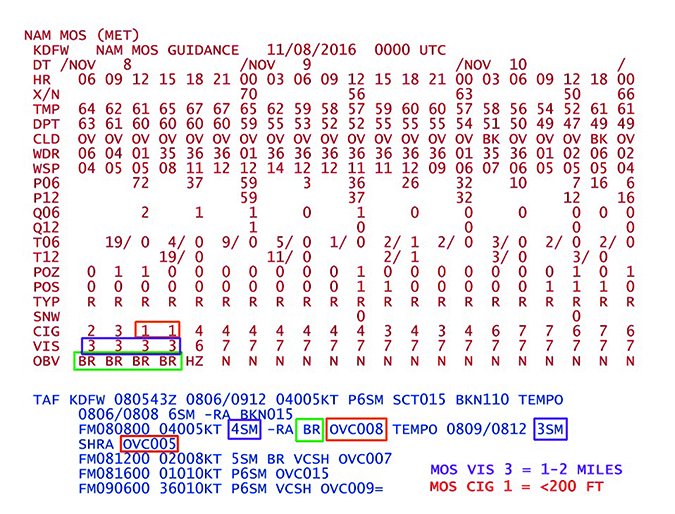
If you want to see what a point forecast might look like, search the web for “MOS output.” Such products are available and provide a 48-hour forecast of wind, chance of precipitation, ceiling, visibility, and more. MOS output is constructed entirely from model data but is filtered through statistical algorithms developed by forecasters to try to more accurately forecast the weather at different airfields and minimize model errors.
MOS data is actually quite valuable, showing expected trends for remote sites and sites without a TAF. Also it will provide exact temperature and dewpoint—helpful for computing density altitude. However the ceiling and visibility often vary from the actual observed values.
This is where the aviation forecasters come in. They refer to all these models to try to understand the prevailing pattern affecting the weather and which processes are occurring at different layers. The forecaster will blend this information with patterns shown on soundings (skew-T’s), radar, surface analysis, and satellite data to make sure it all presents a consistent picture. Some forecasters may also refer to the MOS output shown above, along with MAV output and other tools. And finally, this is blended with current weather observations; if DFW is showing BKN020 and the MOS data shows 2500-foot ceilings for the next six hours, you’ll want to keep BKN020 in your TAF.
Where Things Go Wrong
Forecast failures come from two main problems. The first is model failure, such as when the initial conditions are erroneous. Maybe temperatures are a little too cool over western Iowa or winds are being undersampled in Pennsylvania. The second problem is human failure, when the forecaster is not trained well, is distracted, misses processes taking place in the atmosphere, or doesn’t understand how the processes will come together.
Model failure is always a possibility. Mathematician Edward Lorenz once described how a butterfly flapping its wings in one part of the world might create small air currents that interact with other air currents to produce a storm thousands of miles away a few weeks later. The takeaway here is that the atmosphere is not made up entirely of large-scale motions, but covers a spectrum all the way from planetary motion down to micro influences, and all of these interact.
This is a significant reason why we may never be able to forecast daily weather more than 10 or 20 days in the future. We can only achieve accuracy at longer time frames by ideally measuring every molecule in the atmosphere and processing that data with massive super computers—a futuristic capability we might never have.
It also means that unforeseen errors will always creep into the model fields, even after running the model only a few hours into the future. The less observed data there is in a forecast area, the less accurate the model will be. So conditions at Chicago O’Hare and Atlanta Hartsfield will always have a better baseline of accuracy than Seattle and San Francisco, which are bordered by the wide-open Pacific.
Recognizing the Problems
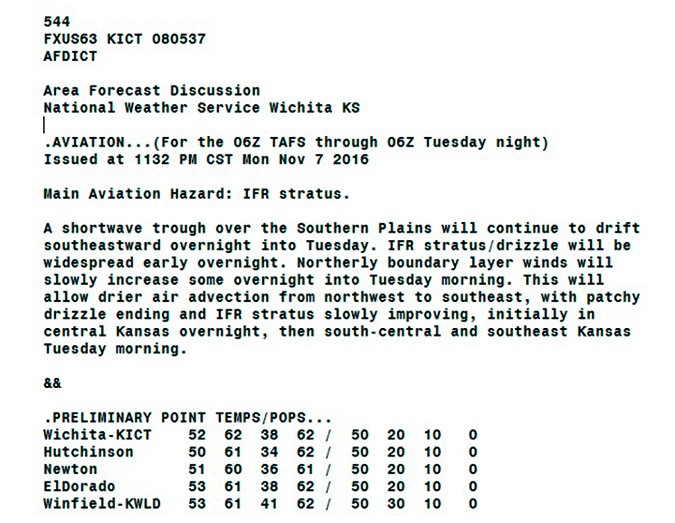
The easiest way to check the accuracy of a forecast is to simply check the forecaster’s confidence. Although you might like to phone the forecaster, it’s not practical. But you can check the area or state forecast discussion. Visit the National Weather Service website and enter the destination location in the box at the top left. Scroll down to the bottom of the page where the “Additional Forecasts” tab appears, and choose “Forecast Discussion.”
This will give you the latest forecast discussion provided by a team at that weather office, consisting of the short-term forecaster, the long-term forecaster, and the aviation forecaster. All of them collaborate on the forecast, so read through the product and it will give you a good idea about what they’re thinking and why. (If you’d like a better understanding of those discussions, there are many fine references available, including some I publish.)
With a little experience you can detect some subtle clues, such as whether a forecaster is relying too much on the models, or is investing a lot of time thinking about the analysis. Also if you frequently depend on a specific TAF, you might want to keep tabs on the forecaster name or their two-digit code in the signature area. After a month or two you’ll get a good feel for who the experts are and which TAFs might need a little more skepticism. Years ago, Forecaster 26 at Fort Worth always meant top-notch stuff, and I’d sometimes check the past 12 hours of discussions to see if he was on shift.
To see which areas the forecaster handles, visit aviationweather.gov, click on the Forecast bar at the top, and on Forecast Discussions. This shows you the regions that forecaster is watching. Note that you can get the aviation discussion here, too, but you’ll be missing the other two forecast desks.
TAF amendments are a good sign of uncertainty. Multiple amendments often mean bad news. You should also verify the forecast by comparing the forecast to reported conditions and trends. If the TAF is failing to verify in one point, you need to be on guard for other unexpected changes such as wind shifts, ceiling and visibility changes, and other possible issues.
Models can go south, too. The easiest way to tell when models are getting it wrong is by comparing forecast wind directions, speeds, and temperatures aloft to your actual conditions at cruise. This flight-level wind and temperature data tends to come directly from the models rather than through a forecaster. If you’re getting an unexpected headwind or tailwind, that’s a good sign that something is off and you can expect problems to trickle down to the TAFs.
Unexpected temperature changes affect the freezing level and can change precipitation types at the surface. Higher than expected temperatures in a winter overcast cloud means the “warm cloud layer” is now deeper, and any snow is likely to change over to freezing rain, sleet, or even warm rain.
Certain METAR remarks can be a warning sign, too. If you see PRESFR (pressure falling rapidly), this is a rare sign that pressure is falling at a rate of 0.06 inches per hour or faster. This requires extra caution not only with your altimeter but also with the forecasts, because rapid changes in the mass fields are occurring at small time scales and this is difficult for the models to handle. The potential for model errors will increase substantially.
What To Do
When the forecast looks uncertain, all is not lost. Pull up other TAFs nearby. And try TAFs issued nearby by other forecast offices: for example Champaign’s TAF is issued by Lincoln’s office, while 60 miles away, Terre Haute’s TAF is issued by Indianapolis. Likewise, military TAFs are produced by Air Force meteorologists and Navy aerographers, so check out Dover AFB when flying into Wilmington, Delaware. As long as the stations are within 50 to 100 miles of each other, the conditions at both locations should be in the ballpark. Contrast and compare them. If they’re looking very different, it’s a good idea to dig deeper.
This gets into nowcasting: the ability to forecast on very small time and space scales—for example, the next 30 minutes for your destination 40 miles away. There are no techniques that can be condensed into a single article, but about half of these Wx Smarts articles provide hints and suggestions for keeping safe around bad weather. The bottom line is to be sure you go into the situation prepared, know your weather fundamentals, and have a plan for getting out of trouble.
Sometimes you need to be a meteorology expert to know all the ins and outs of completing an accurate TAF. But don’t let that discourage you; you definitely don’t need to be a pro to know when the TAF isn’t up to par. As you can see, there are many tricks that help detect a poor forecast. Simply knowing that errors may be present is valuable information in itself, and with a little bit of knowledge about how the TAF is put together and what’s going into it, chances are you can tease other details out of the situation that will help get you on the ground quickly and safely. Situational awareness is half of the forecast, and what we’ve described above explains the rest.
Tim Vasquez is a professional meteorologist living in Palestine, Texas. See his web page and his various materials at weathergraphics.com.


