
After a record winter where temperatures fell below -30 degrees F in some parts of the Midwest, it’s hard to believe summer is approaching again. That means a rapid increase in thunderstorm activity across the country. In this issue our goal is to help you not only understand the parts of a storm but also what’s going on underneath the hood and what it means for the forecast. The information also might help save your bacon when things go downhill unexpectedly and all the data you have is what’s out the window.
A Convection Refresher
Most thunderstorms get their start from sunshine reaching the earth. That’s not always the case as unstable conditions can develop from air advection, especially during the cool season. But the vast majority of storms get their start from daytime heating.
Solar rays striking the earth contain vast amounts of energy. On a hot summer day in Chicago, one square meter of ground receives about 4 kWh of energy per day, which would be enough to run a central air unit for about an hour if it could all be converted. Nearly all of that incoming solar radiation is transformed to heat, warming the ground, vegetation, lakes, roads, and buildings.
This heat is conducted upward to molecules in contact with the ground. These molecules rise, like a hot air balloon, and other molecules rush in below to carry even more heat away. This part of convection is celebrated by glider enthusiasts, because the heat rises off the ground in the form of thermals rising at 500 fpm or more. The contact layer at the ground can be seen as shimmer or ripples, due to refraction.
Over a few hours, the thermals rise thousands of feet into the atmosphere. The thermals gradually cool and descend, like fluid in a lava lamp, while more thermals rise up in other places. This churns the atmosphere and produces a series of cells, with downward and upward motion. These cells are sometimes visible in the form of cumulus streets, which line up like rows of crops.
The top of these thermals forms the top of the planetary boundary layer (PBL). The PBL is always based at the ground. Friction and thermals act on the atmosphere in the PBL and vertical mixing of the air mass occurs. This air mass often contains pollutants, dust, and haze. Above the boundary layer is the free atmosphere, which is typically drier with excellent visibility.
You can often see the transition from the PBL to the free atmosphere when you’re flying, as it’s marked by a transition from bumpy mechanical turbulence and hazy conditions to smooth, clear air above. The top of the PBL rises from barely rooftop level during the morning up to 5000-10,000 feet on a hot sunny day, and often higher in dry climates.
Along Comes Moisture
Moisture is an important ingredient, because it allows latent heat to form within rising parcels. We covered a bit about instability and latent heat in the last issue. On a hot sunny day, the thermals eventually begin producing cumulus clouds. These typically start at a height about one to two thousand feet AGL during the morning and rise to 4000 feet or more during the afternoon as temperatures warm and relative humidity falls.
With instability (warm surface temperatures and cold upper-level temperatures) and available moisture (high dewpoints), the cumulus clouds will grow into “moderate cumulus” and then “towering cumulus.” These are the last stages before thunderstorm development. Old-timers might remember seeing MDT CU and TCU in METAR remarks. This information is still transmitted at many airports in the Caribbean and Latin America and can help you keep tabs on convective development in areas where timely forecasts are hard to find. Where MDT CU and TCU are reported, the direction is valuable for telling whether the storms are generated by mountains or are over valleys and coastlines. This distinction helps paint a picture of what’s coming in the hours ahead.
The Storm Takes Shape
Once the cloud tops have glaciated—produced ice, taking on a soft appearance—the cloud is considered to be cumulonimbus and can be assumed to be producing a thunderstorm. This is where thunderstorm processes take shape.
The rising cumuliform cloud so far represents an updraft. This is one of the two primary parts of a storm. Eventually collision and coalescence of the cloud droplets produces precipitation. As this precipitation falls out, it chills the air around it through evaporational cooling, and drags the air as it falls. This produces the downdraft, the other important part of the storm. Visually it’s easy to tell the two apart. Solid cumuliform towers and distinct storm bases both represent an updraft area, while precipitation shafts and virga represent the downdraft. Precipitation differs from cloud material in that it has a fuzzy or shrouded appearance.
We also see inflow and outflow areas develop around the storm at the ground. The inflow tends to feed the updraft, while the outflow is produced by downdrafts. If you’ve ever seen training material where a microburst sinks and spreads at the ground, you’re essentially witnessing a downdraft reaching the surface and spreading into outflow.
This is where “microburst” gets its name: It describes a downdraft and outflow area that measures three miles or less in size horizontally. The outflow eventually spreads to a much larger size, but early in its life cycle a compact downdraft often has dangerous wind velocity gradients. This is what either damages planes from airframe failure or results in airspeed deviations with such speed and amplitude that the plane loses control. Delta Flight 191, a Lockheed L-1011 that crashed in 1985, was the pivotal event that underscored the danger of microbursts in American aviation and showed that even large planes with well-trained pilots weren’t immune.
The Storm’s Demise
When we have paired active updrafts and downdrafts within a thunderstorm, we classify the storm as mature. A long chain of processes might have helped produce the storm, but already it’s heading for trouble. The culprit is the outflow. And there’s no getting around it because there has to be somewhere for the downdraft air mass to go. When it reaches the ground, it diverges, spreading rain-cooled air in all directions.
The outflow can spread underneath and choke the updraft and the storm is then considered to be in its decaying stage. As the updraft dissipates, we see the storm lose its clusters of cumuliform clouds and evolve into an amorphous mass of rain.
We’ve just described an ordinary thunderstorm. Eventually the rain is gone, and the only thing left is an orphan anvil of cirrus and mid-level debris clouds like altocumulus. But some factors can keep the storm going.
During summer in much of the southeast United States and in tropical regions, there are so many thermals growing that storm updrafts are everywhere. This produces multicell cluster. It has multiple updraft-downdraft pairs in one large cloud at different stages of their life cycle. When an updraft dies off, another takes its place several miles away and the party keeps going.
This scenario is most common with weak instability, weak winds aloft, and no “cap” or “lid” (a layer of warm air) in the mid-levels suppressing things. The only thing that shuts down a multicell cluster is when rain-cooled air gets so extensive the storm can’t keep going, or when evening arrives and the lack of heating shuts down the festivities.
If winds aloft are moderate, say 30 knots or more, a storm cell will often orient itself with respect to the wind field. Downdraft air will be deposited downwind. This means the cold pool develops a lot further from the storm, called updraft-downdraft separation. It’s then more difficult to cut off the updraft. A multicell line often results. They’re common in spring in the Great Plains and summer evenings in the Corn Belt.
A multicell line looks like a large thunderstorm but the activity tends to shift toward one direction, typically toward the south or southwest direction in the Northern Hemisphere. Old cells are left behind on the north side and younger developing cells, known as the flanking line, develop on the south side. This causes the storm to propagate toward the southeast, even if individual cells are moving northeast.
Another type of storm is the squall line. This is often seen in the same conditions that favor multicell lines. It happens when multicell storms produce a large cold pool spanning tens or hundreds of miles in size. The cold pool may also come from a cold front. The leading edge of the cold pool acts like a wedge, maintaining updraft towers (and storms) along its length. For this reason, meteorologists sometimes refer to the squall line as “cold-pool driven convection.”
Chart Interpretation
This surface weather chart for a typical system found in the Central or Eastern U.S. shows a warm and cold front, an occlusion (purple), a dryline (brown), and an outflow boundary (dashed black line, lower right) that can help you understand what’s happening.
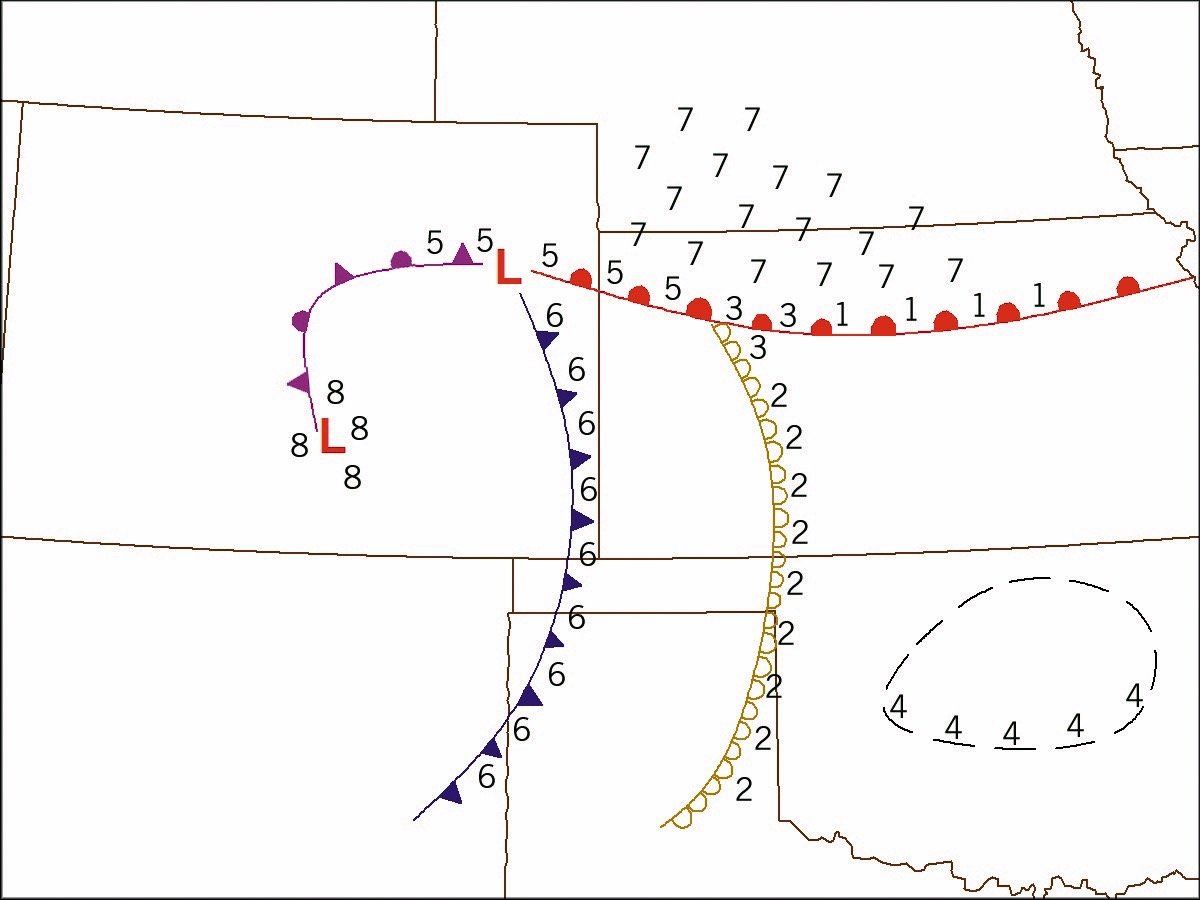
- The warm front is a favored location for severe storms, but not all warm fronts will be active.
- The dryline is famous for its severe storms. They’ll be strongest on the north side.
- This is the triple point. It’s the danger zone, with the best potential for severe storms.
- Outflow boundaries are usually benign but can spawn severe storms if it’s unstable enough.
- In the High Plains, this is the upslope area, favoring hailstorms. Otherwise expect showery weather.
- The cold front represents an advancing cold pool, so it’s most likely to bring a squall line.
- This is the cool sector. Any storms would likely be weak, elevated, and embedded in low cloud.
- Near the upper low. Hailstorms are possible in the afternoon if surface temperatures are warm.
Supercell: King of Cyclones
The supercell storm usually forms in areas with moderate to strong upper-level winds, and strong instability. It develops much like the multicell line, except that the balance of wind forces produce a pressure deficit inside the storm, known as a mesocyclone. This mesocyclone is weak at first and measures several miles in diameter. As it strengthens, it intensifies and contracts to a couple miles. The spiraling inflow, which appears clear on radar, and the spiraling outflow, which appears rain-filled, gives the supercell its unique hook-echo shape. The mesocyclone also helps concentrate the storm by dominating the surrounding wind field, preventing other cells from developing inflow and updraft regions. This is why many supercells are isolated.
Although the mesocyclone draws rain-cooled air into the updraft area of the storm, the pressure deficits help propagate the storm away from the cold air. This produces right or deviant motion. In an environment where storms are moving toward the northeast, supercells will often be moving southeast. This is one way of identifying a supercell when viewing radar loops.
Tornadoes—beyond the scope of this article—tend to form close to the mesocyclone, adjacent to the inflow air. On regular radar, the best places to look for them are at hook echo tips, within concavities, and near strong reflectivity gradients.
In the Cockpit
With this understanding you can better anticipate what’s coming your way. The storm environment tells you what to look for. Unstable conditions—a CAPE value over 1000 or a Lifted Index below -3—often mean storms. These numbers are on some Aviation Weather Center and upper-air products. Flight-level winds can be excellent indicators of storm severity. Jet-stream winds of 50 knots or more strongly indicate the potential for organized storms.
Dry air in the mid-levels increases evaporation in downdrafts, increasing the risk of microbursts and downbursts. If the TAFs and SIGMETs expect storms, excellent visibility between 10,000 and 25,000 feet is a good indicator that you may have microbursts to contend with.
Watch your weather radar reflectivity and gradients. Reflectivity gradient is how close the strongest echoes are to weaker echoes. A storm core near the edge, with very little distance to the edge, shows as a steep gradient. Weak reflectivity and weak gradients usually indicate an ordinary thunderstorm. Transient, concentrated areas of strong reflectivity or strong gradients might indicate a dangerous downburst or microburst.
If the storm is disorganized on radar with weak reflectivity, you probably have a multicell cluster. But if a strong cell shows just one main, persistent core, it’s probably a multicell line. Elongation of a line of moderate or strong cells along a line measuring 100 NM or more is a good sign you have a squall line.
With supercells, we look for a distinctive triangular, V-shaped, or hook-shaped appearance easily spotted on radar, but velocity products can confirm a mesocyclone is there let us make sure we haven’t missed anything. If not, it’s probably just a multicell or a squall line.
There you have the basics of thunderstorm forecasting. If you want to stay completely safe, observe the 20-mile safety rule, prescribed by the FAA and developed from a century of flying experience. And if you’re really in a bind, ask ATC for help, as they can see the cells clearly. Their S-band radars are far more powerful than airborne radar units, and more timely and reliable than datalink radar. Stay safe.
Tim Vasquez not only forecasted storms for Air Force crewmembers but also wrote the most widely recognized handbook for storm chasers. His weather office is in Palestine, Texas.


