
Not many years ago your airborne weather information was limited to what you could see out the windshield and what information you were able to gather on the radio from Flight Service—if you could reach them. Plus, reported weather was limited. Thus, it was nearly impossible to form a full, accurate mental image of the weather.

The depth of weather information available in the cockpit today is mind boggling. So much so that we wonder how much of it most pilots actually use.
Can’t Put It Together?
Not only is there an abundance of weather data, but using it can be confusing. Some of that weather can be displayed with other information while some can’t. Some products are grouped while some only display alone. For example, on the Garmin G1000, Echo Tops can’t be displayed with NEXRAD or Cloud Tops. Nor can you display topography or terrain at the same time as NEXRAD. Some, like winds in 3000 foot increments, have a range of options that can only be displayed one at a time.
While different weather products can and can’t be displayed on any given page, you might find that your system has multiple pages where you can select different weather products. On the G1000, for example, in addition to the normal navigation map display and the PFD’s inset map, NEXRAD can also be displayed on the Airport Information page, Trip Planning page, Nearest page, Flight Plan page, and, not surprisingly, the Weather Data Link page.
Of course, adding to the confusion is that some weather products are better at helping you through specific situations, so what you use and how you view it is a variable based on the actual weather you’re encountering. All in all, it can be overwhelming and learning how to best utilize them all can be a challenge. But the benefits are worth the effort.
Let’s Be Realistic
Let’s begin with a recommendation. Tremendous advantages aside, satellite weather has certain limitations, so obtaining a thorough preflight briefing, either through a briefer or one of the online preflight briefing sources, is the template onto which the pilot should lay all satellite weather information.
Keep in mind that weather from sources other than a local sensor will have some latency. While the XMWX Satellite Weather displays may include the time of the last update, the actual data is always older.

On the G1000, the update time shown is the time the data was assembled on the ground. If you factor the initial data capture time prior to the assembly, add any delays before it’s transmitted to your receiver and you look at it, you might find that you’re actually looking at weather information that’s 20 or more minutes old.
In addition, individual products update at different frequencies. For example, on the G1000, Cell Movement is updated every minute and thirty seconds, Lightning is updated every five minutes, Echo Tops every seven minutes and thirty seconds and Cloud Tops every fifteen minutes. Twelve minutes seems to be the normal update time for most other products.

Also be aware that most of the data has an effective shelf life of 30, 60 or 90 minutes. On the G1000, if more than half the specified period has elapsed, the data color changes to yellow. If the data hasn’t updated within the effective period it is no longer displayed. You should determine exactly how this works on your system.
Once you understand the inherent data latency and limited life, it’s obvious why satellite weather shouldn’t be used for tactical weather avoidance. But, utilizing all of the weather products for intelligent strategic planning means that satellite weather can provide useful, ad hoc decision support to the cautious pilot.
Know What You’ve Got
To ensure you get the most from your satellite weather, make certain you have the products turned on. Then, make sure each is set to your preferences. On the G1000, for example, you can set map distance thresholds for most of the individual products. If you zoom out, only the desired information is shown at the larger scales to minimize map clutter.
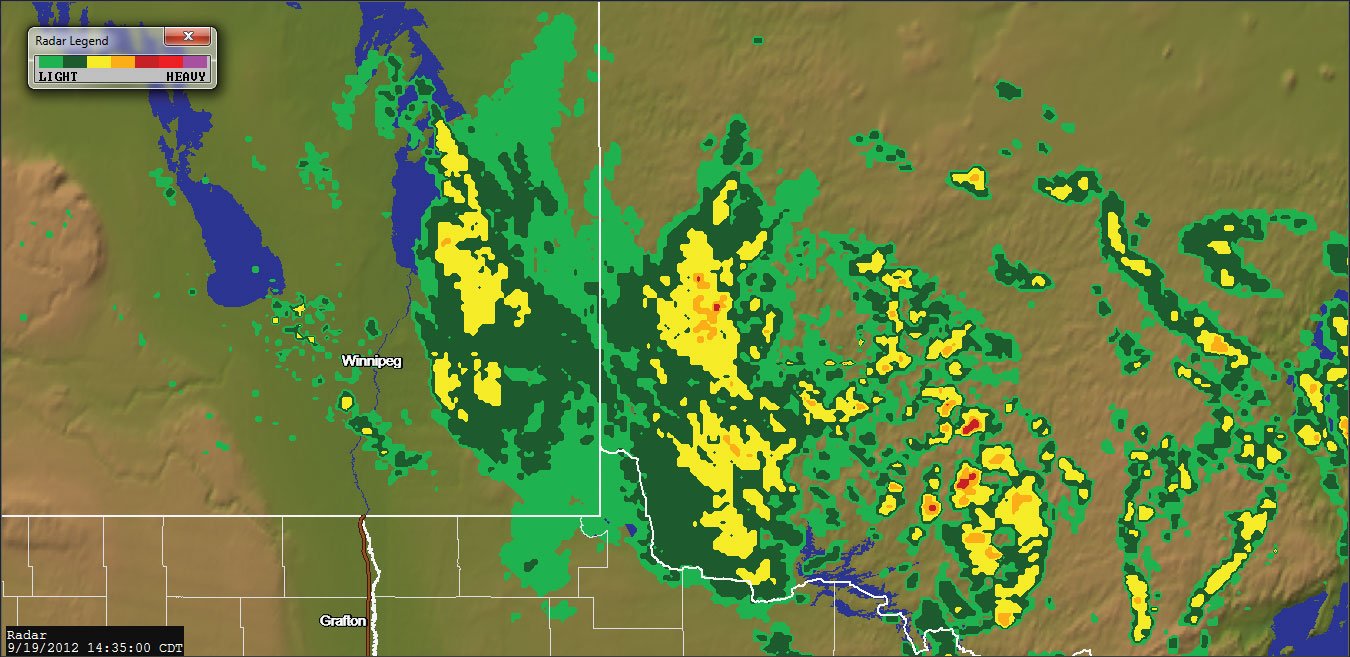
On any trip where convective weather or precipitation is an issue, NEXRAD is typically the primary choice. NEXRAD consists of at least 158 high-resolution Doppler radar systems, each of which has a 250 mile range. The total coverage is approximately 97% of the contiguous US. Their data is combined into a single nationwide mosaic that is broadcast every 5 minutes. But, it has limitations.
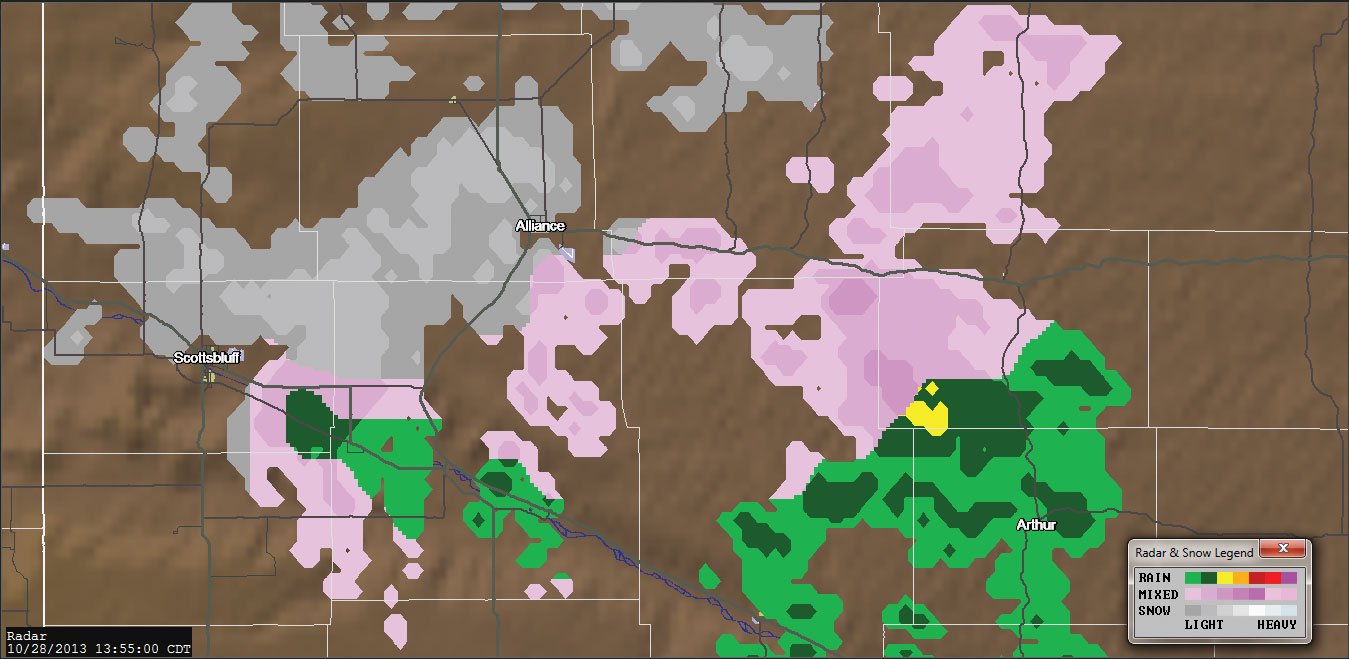
Base reflectivity isn’t sufficient to identify cloud layers or precipitation characteristics. It won’t indicate if the precipitation is rain, wet snow, wet hail or dry hail. For this and other reasons, XMWX Satellite Weather provides a composite reflectivity product.
Areas with no radar coverage should be indicated on the display. Just because you see nothing doesn’t mean there’s nothing there. In the case of the G1000 these areas are highlighted by a transparent grayish-purple overlay on the affected area.
Because the radar antenna is aimed at a low angle any substantive weather near the radar site won’t be visible. Also, the resolution of the weather display is four square kilometers and the weather intensity shown for that area is the highest intensity sampled within that square.
Putting It To Use
To help put all of this in context, let’s walk through how you might use satellite weather.
Even though my on-board system provides almost everything I need, when weather conditions warrant, I still get periodic updates from Flight Watch to ensure I have the most current information and that I know of any new AIRMETs, SIGMETs, or PIREPS.
In questionable or challenging weather, I review almost every weather product numerous times throughout each flight. I begin by looking for SIGMETs and AIRMETs and also determine the freezing levels along my route.
I use the weather information to fine tune my altitude selection, both for winds and to avoid IMC, particularly if there is convective activity or if I’m near the freezing level.
Winds are displayed in 3000-foot increments so I usually review the winds at just the few altitudes that normally encompass my optimum cruising altitude. I then interpolate for intermediate cruising altitudes to find the most efficient. A few years ago I was returning to Northern California from Seattle in my Malibu. The headwinds were so strong that rather than the planned FL230 or FL250 I selected 9000 feet. That required analyzing 6 sets of wind data down to the MEA to find the most efficient altitude.
Viewing the Winds pages at a large scale aids your enroute analysis. It’s then easy to picture the broad wind flows to pick out the optimum altitudes and routes. This information has, for example, helped me take advantage of the winds by picking between a northern vs. a southern route east around the Sierras and Rockies.
I review both Cloud Tops and Echo Tops to look for an altitude where I can remain in VMC. It’s important to note that while Echo Tops uses radar to find the highest returns, it might not indicate the actual cloud or storm tops. Cloud Tops, on the other hand, utilizes satellite imagery to determine the altitude of the visible tops of the clouds.
When rain or convective weather is a concern, I set the NEXRAD map to a range that shows approximately 1 hour of flight ahead. I occasionally change to a shorter scale for deviations and a longer scale, often including my final destination, for more strategic planning. Part of monitoring is periodically checking both NEXRAD and Surface Analysis at the destination or intermediate/alternate airports by panning and zooming in to show each airport’s relatively local area. I also review the airport’s current weather reporting and TAFs through the WX information on G1000’s airport page. Both the METARs and TAFs are time stamped so you should always start by comparing the date/time stamp with GMT to know how current the information is.
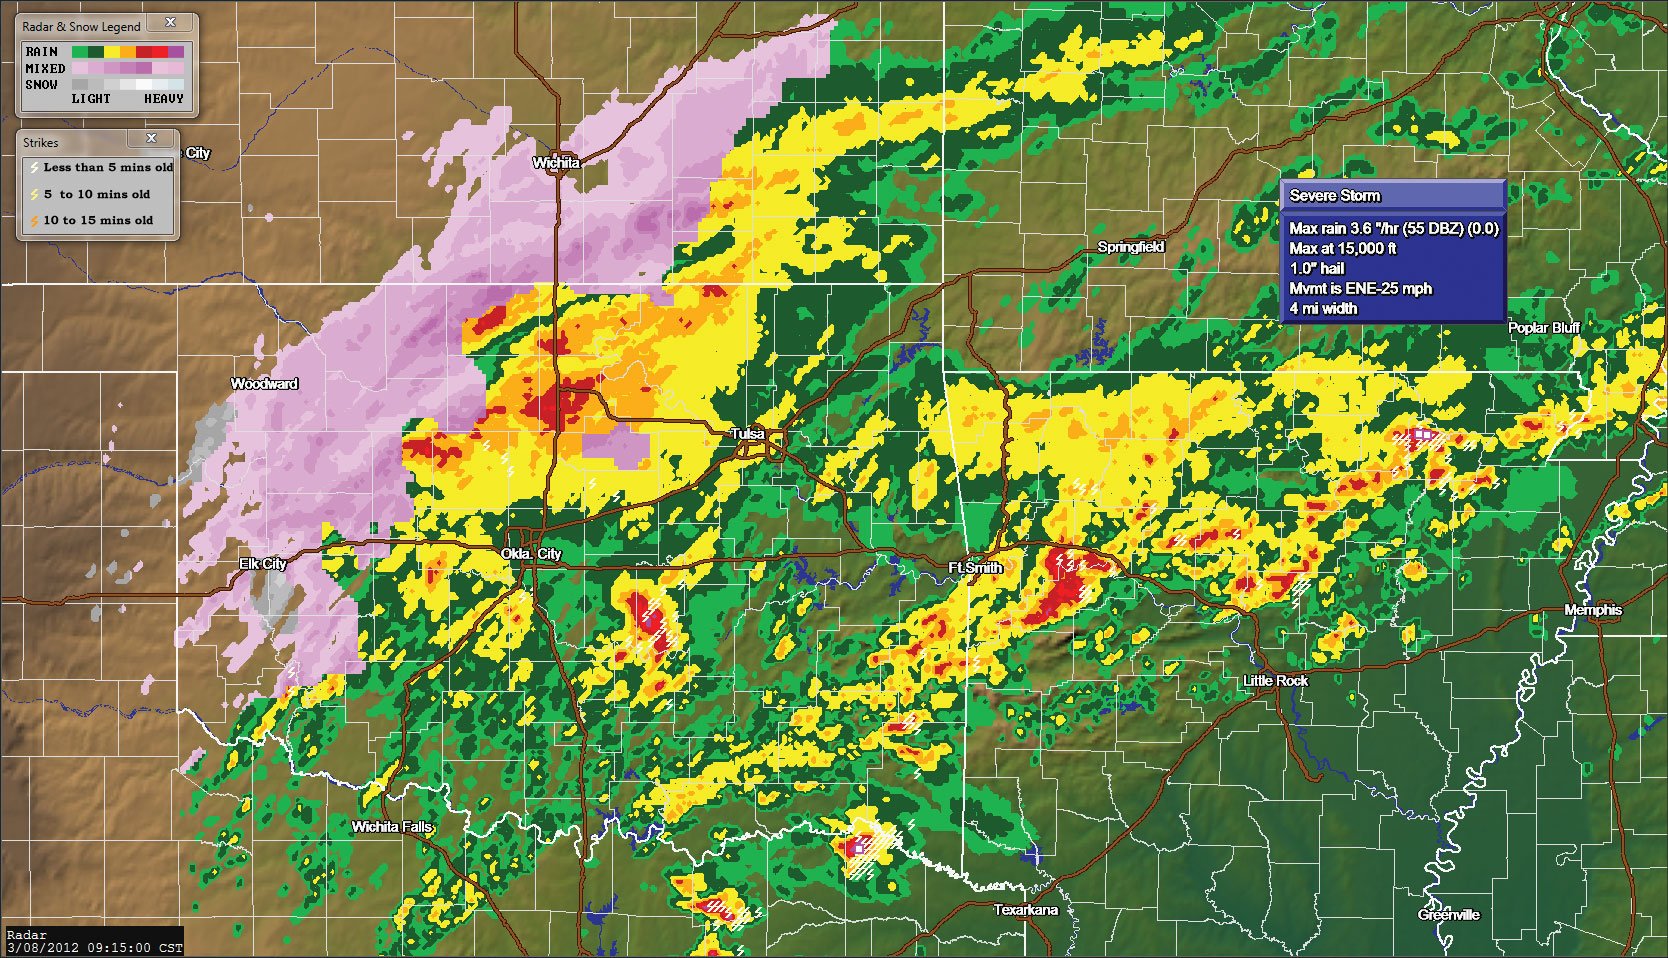
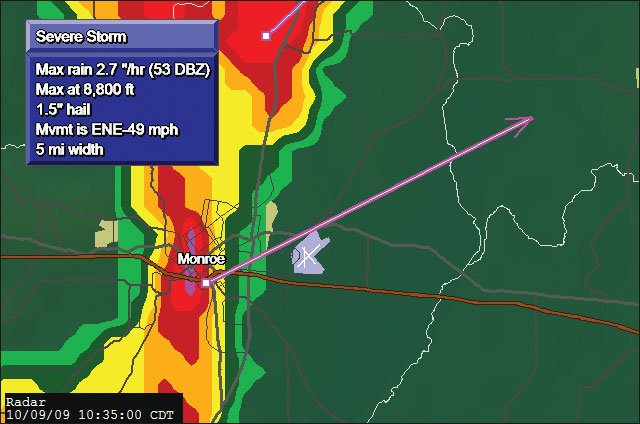
In addition to tracking current conditions, it’s important to monitor movement and intensity changes of convective or frontal activity. Watch the color of the displayed precipitation to see the reflectivity level, the overall size of the precipitation area, number and locations of lightning strikes, number of cells, wind direction and speed, height of the Echo Tops, and frontal movement and speed.
Watching groups of cells can be enlightening. The Cell Movement display has a small arrow from each cell icon indicating the direction the cell is moving. You might think that a group of cells would all be moving in the same direction, but that’s not always the case.
Except with the most widespread and challenging weather, a careful analysis can usually identify paths that keep you away from the worst. In many cases selecting a routing upwind of the most intense weather is the safest choice and, of course, climbing or descending might also be prudent alternatives. Keep in mind that with satellite weather, avoidance is the best practice since penetration requires real-time updates.
Sometimes the weather precludes safe passage. So, in addition to monitoring weather between me and the destination, I’m always considering alternates should a diversion become necessary. Recently I was enroute from Erie, Pennsylvania to Rockford, Illinois. Checking the Rockford weather at about the halfway point showed that the weather didn’t fit the forecast; the winds were gusting over 30 knots. Because I’d been monitoring Rockford since departure, I’d already identified a good alternate and had the new route ready. Execute and divert.
With questionable enroute weather, I want a constant indication of the surface weather at nearby airports in case I’m considering descending below the weather. The G1000 has an option called “METAR” which displays color coded flags by each airport that has weather reporting. These flags indicate if the airport is VFR, MVFR, IFR or LIFR. A glance at the map gives a good sense of what the underlying ceilings and visibilities are. The more airports there are in the vicinity, the better the overall picture.
For more detailed information like winds and temperature, I check the text version of the reported weather. I might also listen to the ATIS/AWOS. Even with all of the onboard weather information, when the weather’s questionable I’ll also check with Flight Watch to verify the current information and they occasionally provide knowledge on weather changes before it’s available through satellite weather.
One thing to keep in mind is that while the METAR flags or even the actual reported weather give a broad sense of either the area or a specific airport’s weather, it doesn’t indicate whether an airport’s approaches, if any, have low enough minimums for the current conditions. If a diversion is likely, doing that additional analysis ahead of time can ensure you’ll be diverting to an airport where you can actually land.
Watch Out
My father, who navigated using the old A-N low frequency ranges, would be astounded by the wealth of weather information that can be available in a general aviation cockpit. But today’s pilots share with those older pilots the best weather avoidance tool ever invented —the Mark One Eyeball. No matter how sophisticated the weather products are, when the severity of the weather dictates, the best plan is often to remain visual. Seeing is believing…and avoiding.
Joe Shelton uses XMWX Satellite Weather on the G1000 in his Columbia 400 to help him deal with weather as he flies around the U.S.


