
From a weather perspective, what makes a flight a no-go? Sometimes it’s a simple glance at a stormy sky, an icing SIGMET, or winter weather warnings on the TV. But more often it’s the TAF that calls the shots. Whether it’s freezing rain, low ceilings, or a gusty crosswind, the buck stops with the TAF. That report comes straight from a highly qualified aviation forecaster at a local National Weather Service office and represents the best available predictions.
But what if you’re contemplating a bit of flying this weekend? Accurate weather maps for days out are available, but there’s no such thing as a three-day TAF. There’s nothing out there to tell you for sure whether ceiling and visibility will cooperate, and model forecasts of those exact values are erratic and don’t tell much about the big picture. This is where it helps to be able to think like a forecaster and root out those processes that are responsible for low ceilings and visibility. Not only can this help your general flight planning skills, but you can also use your knowledge to cross-check each TAF you see and look for factors that might throw an unexpected diversion your way.
Why Do I Need to Know This?
Why delve into the basics of ceilings and visibility? Let’s turn to a popular aviation buzzword: situational awareness. Can you define it? If you answer something about being alert to safety of flight issues, this would be a situation where Alex Trebek waits a couple of beats for your full answer. Your answer was one-third correct.
Situational awareness, the foundation of in-flight safety, requires not only awareness but also comprehension of what is observed and skillful prediction of what’s ahead. Most aviation weather resources and techniques help you remain aware of factors that matter and help you spell out a safe plan. But it is up to you to go the extra mile to develop a true sense of weather-based situational awareness by flexing your comprehension skills. With that, you’ll gradually forge an ability to predict a weather system’s next move.
That’s why I try to avoid laundry lists of tips for dealing with adverse weather. The FAA’s Aeronautical Information Manual and Aviation Weather For Pilots have that covered and form the bedrock for safe weather flying. These WX SMARTS articles are crafted to build on this and help you think like an aviation forecaster so you can comprehend the more difficult IMC situations you’ll encounter. So when Mother Nature throws a wrench into the works, rather than going back to the charts you saw an hour ago for a new game plan, you can make immediate, informed decisions.
Stability Is the Game Plan
From an aviation forecaster’s standpoint, stability in a layer is probably the single most important variable that dictates the weather conditions. Stability is governed by the change in temperature with height. If the temperature falls slowly or rises with altitude within a layer, this is an indication that the layer is stable. If the temperature falls rapidly with height, this points to an unstable layer. Pretty simple, right? There are classes of instability like conditional and absolute instability, but in aviation this distinction is not important.
How can you tell whether a layer is stable or unstable? Meteorologists simply look at a sounding and mentally tally up what they are seeing, but these use skills that would require a whole new column to describe, and would probably put many of you to sleep. However you can make a very accurate appraisal by reading the sky and looking at subjective factors.
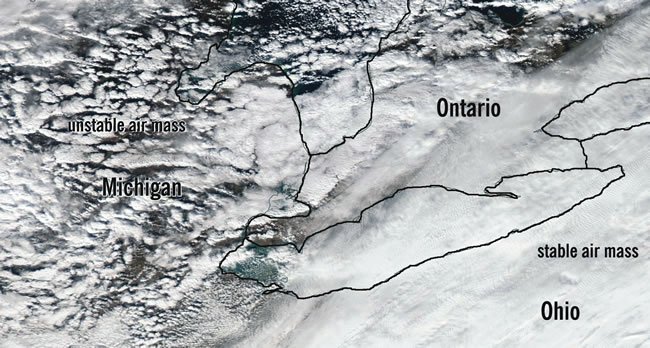
In an unstable layer, there is a strong tendency for vertical motion to occur. We find these attributes: smoke columns tend to rise vertically, visibility is excellent, turbulence is favored, wind tends to be gusty, and cloud layers tend to be cumuliform. It may seem counterintuitive that we would find excellent visibility in an unstable layer, but the deep vertical motions disperse haze and fog.
It’s just the opposite in a stable layer. Smoke columns drift horizontally, visibility is reduced, haze and fog are likely, turbulence is dampened out, wind is steady with few gusts, and cloud layers tend to be stratiform. Keep in mind that there can be multiple stable and unstable layers at different heights: for example in Oklahoma in the springtime, there is often a thin, strong stable layer at about 5,000 feet that separates an unstable layer above, enhanced by upper level lift, from an unstable layer below, caused by solar heating and a rich moisture supply. When this stable layer, called a cap, is broken down, well, you saw what happened to Dorothy’s farm in the Wizard of Oz.
Pinpointing Stability Changes
So how can you anticipate where stable and unstable air will develop? The most familiar rule of thumb to pilots is that the sun heats the ground and produces unstable air, while at night, the ground cools and the air becomes stable. This rule is perfectly sound, and is also intuitive since some of the smoothest flying is found in the morning.
There are other factors besides the sun. Meteorologists like to look at the source of a low-level air mass and compare its temperature to the terrain it is passing over. If the air mass is warming, this promotes a cold-over-warm (unstable) configuration and means the air mass is destabilizing. Fresh cold fronts passing over the Midwest in the fall and cold Santa Ana winds in Los Angeles are classic examples of this, explaining why you get bumped around a lot from the surface up to a few thousand feet. Cold air passing over the Great Lakes in the winter is another example—the air mass destabilizes and Buffalo readies the snow plows.
Likewise, warm air passing over cool terrain promotes a warm-over-cold (stable) situation and is associated with stabilization. The west side of wintertime high pressure areas where southerly winds are blowing is a good example. The ride will be smooth and there may be a tendency for fog and haze to form.
Vertical Motion
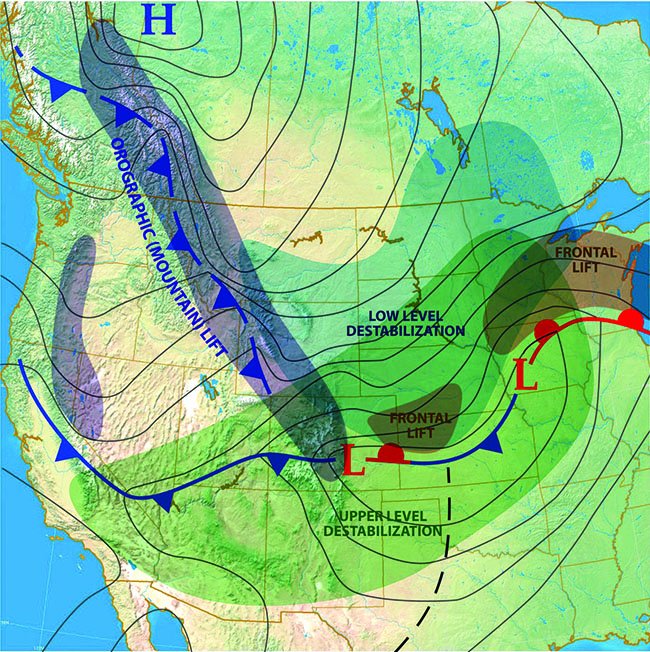
While stability is good for a snapshot of the character of the air mass, rooting out any sources of vertical motion helps give us a picture of the overall trend. Here we are not talking about turbulence and chop, but rather the mean vertical motion of a sample tens or hundreds of miles in width. Sources of vertical motion can range from the 3-D shape of meteorological fields, which cause broad regions of air to rise at a slow rate, all the way to mountain ranges which cause localized, sometimes intense lift.
Vertical motion is important because if we force air to rise, it cools adiabatically. If enough moisture is present, it will quickly reach a temperature at which saturation occurs. Condensation will be squeezed out in the form of cloud droplets. If rising motion continues, enough cloud droplets can be produced to form precipitation. The process also releases latent heat, which feeds energy back into the weather system. Hurricanes are experts at doing this.
Sinking motion, or subsidence, lowers relative humidity. Any condensation evaporates back into the air, and the air is clear and warms adiabatically as it sinks. The relationship between vertical motion and weather is so closely linked that forecasters would be out of a job if this could be predicted accurately. But vertical motion is one of the most difficult characteristics for supercomputers to predict, because large-scale vertical motion is quite weak and is eclipsed by horizontal wind by orders of magnitude. Meteorology is very much based on getting all the math to work correctly to convert observations into that miniscule quantity of vertical motion.
Finding Vertical Motion
It’s pretty straightforward to figure out what kind of stability we’re dealing with, but vertical motion on a regional scale is trickier. Fortunately, some rules of thumb do apply.
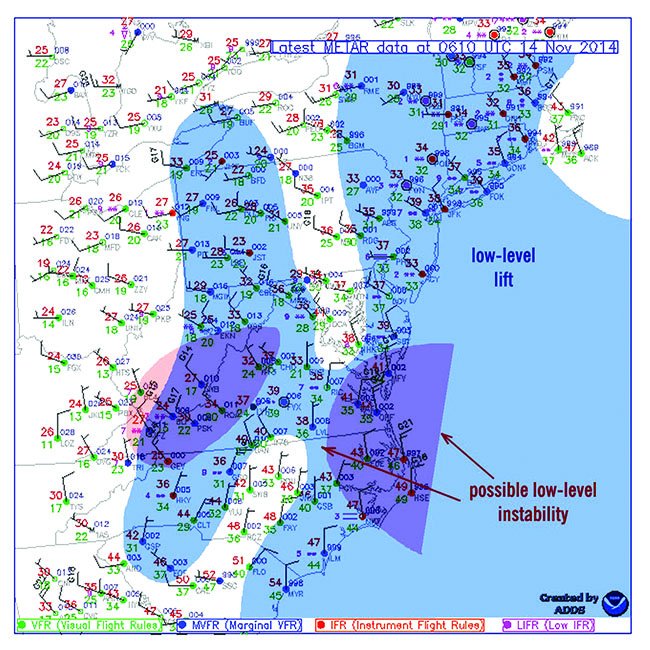
In the lower troposphere, where most general aviation flying is done, simply look at the winds aloft and examine the temperature of the layers from the ground up to your flight level. If the winds flow horizontally from warm air toward cold air, this suggests lift, while the opposite suggests subsidence (sinking). A classic example is air flowing south-to-north over a warm front. This indicates a broad area of lift starting at the warm front and extending northward. Conversely, air along a cold front usually flows west-to-east, suggesting sinking motion.
So if there is a tendency for large-scale sinking motion along the cold front, why do we often find bad weather here? True, the atmosphere supports subsidence in the lower levels, but convective lift from instability is still a major player. Ahead of the front, moisture and instability can create powerful thunderstorms, regardless of any weak, large-scale subsidence.
And behind the front, if fresh cold air is crossing over warm terrain, it will produce lots of shallow cumuliform clouds, though there is enough large-scale subsidence where they tend to flatten out rather than grow into deep showers. Compounding this is upper-level (mid- and upper-tropospheric) lift, which acts independently of our low-level rule of thumb.
The rule of thumb for upper-level lift is that it is most often found downstream from upper-level troughs. The upper lift produces stratiform mid and high cloud layers, and it also has a tendency to destabilize the entire atmosphere with time.
Humidity Factor
Cloud or fog creation depends on the relative humidity of the layer. You can have lift and instability with no visible clouds if the air is dry. A general rule of thumb is any layer with a relative humidity of 70 percent or greater is likely to produce broken ceilings. Overcast layers are likely when the relative humidity reaches 90 percent or more. Any lift compounds these conditions and produces the cloud material, or worsens it.
Simplistically, relative humidity is the ratio of moisture currently in the air compared to the amount it holds when saturated. Meteorologists use measures such as vapor pressure and mixing ratio to work with these quantities. For pilots, dewpoint and temperature are excellent proxies for understanding what’s going on with water vapor. Air temperature can be thought of as a proxy for the air’s “holding capacity” for water vapor: the warmer it is, the greater the capacity and the lower the relative humidity, while dewpoint defines the actual amount that exists.
A simple rule of thumb holds that if the temperature and dewpoint are within five degrees C of each other, the relative humidity is roughly 70 percent or more. If they meet, the air is saturated and relative humidity is 100 percent.
To achieve high relative humidity, either the air temperature has to chill to near its dewpoint, or the dewpoint has to rise to close to the air temperature. Dewpoint is dictated by the actual amount of water vapor in the air, so the only practical way to increase it is to pass it over warm water bodies such as lush farmland and swampland. This takes time. It’s far more common for temperature changes to change the relative humidity.
Radiational Cooling and Fog
Radiational cooling is a powerful mechanism for increasing relative humidity by dropping the temperature. This occurs almost everywhere at nighttime under clear skies where heat is radiated from the ground into space. The air in contact with the ground becomes cold, and the air cools close to its dewpoint temperature. In most cases the result is a light dew and possibly patchy fog.
Ground moisture changes things quite a bit. If there has been rain during the past few days, high dewpoints are maintained and the relative humidity soars quickly at night. This can produce thick layers of fog. But the wind plays into this: if winds are calm, most of the moisture settles out as dew, and if winds are strong—above 10-15 knots—the fog rises off the ground and a layer of low stratus forms instead.
Upslope flow is another mechanism that cools the air adiabatically. If winds are easterly over Nebraska, for example, a parcel near the ground flowing from Omaha to North Platte might start out with a temperature and dewpoint of 18 and 16 degrees Celsius, cooling adiabatically to 15/15 at North Platte. The result is a trend towards overcast layers and possibly fog in western Nebraska. Watch those TAFs over the Great Plains when winds are out of the east.
So there, you have it: the basic toolbox of understanding what factors go through an aviation meteorologist’s mind when they’re looking at the charts. While their job is often thought of as pouring over upper-level charts and sketching over isentropic charts, the questions they are actually asking themselves are variations of all the material above: “Where are things destabilizing?” “Where is the relative humidity increasing, and what might be contributing to it?” “Where is vertical motion developing?” All of these contribute to deteriorating ceilings, visibility, and precipitation. Now you can keep an eye out for these factors, too.
Tim Vasquez is a professional meteorologist located in Palestine, Texas. See his website at www.weathergraphics.com.


