
Getting real utility out of your aircraft requires confidence you can get home after several days away. Here’s how to see LIFR coming days in advance.
Sometimes the standard forecasts just aren’t enough. The area forecast (FA) and terminal forecasts (TAFs) are fine for anticipating the weather for the next day or so, but they simply don’t extend out far enough in the future to tell you if IFR conditions might mess with your plans three days down the road.
Prog charts found on the ADDS website only provide guidance out to 48 hours. In addition, these progs charts depict areas of precipitation, but say nothing about ceilings or visibility. The Hydrometeorological Prediction Center (HPC) offers prog charts for seven days out (www.hpc.ncep.noaa.gov/medr/medr.shtml), yet there’s still no specific information on these charts about ceiling height or visibility.
That omission may even be misleading (as you’ll see in a moment) but don’t cast out the prog charts or area forecasts just yet. A widespread low IFR event ordinarily doesn’t happen without some kind of large-scale synoptic support. So the prog charts can provide some important clues.
Gathering MOS
To zero in on ceilings and visibility up to three days in advance, try a model-based forecast called Model Output Statistics (MOS). MOS is derived from numerical weather prediction models that forecasters use. Those models don’t automatically produce a point forecast for a specific town or airport. Consequently, MOS takes the “raw” model forecast and attempts to improve on it by making a more useful site-specific forecast with weather elements critical to pilots, such as ceiling and visibility.
MOS guidance can be displayed for specific airports including many airports not currently serviced by a TAF. Depending on your destination, you may be able to see a categorical forecast (i.e., VFR, MVFR, IFR, etc.) for ceiling height and visibility for up to three days in the future. To determine the widespread nature of the event, MOS guidance can also be graphically contoured over a geographic area the size of the conterminous United States. Displaying the categorical ceiling height and/or visibility graphically in this way is perhaps the best approach to use MOS for longer-range guidance.
The Global Forecast System (GFS) is one of two models for which MOS guidance is offered. The GFS MOS, also known as the MAV, provides a forecast out quite far in the future with various weather elements including ceiling and visibility (www.nws.noaa.gov/mdl/
forecast/graphics/MAV/).
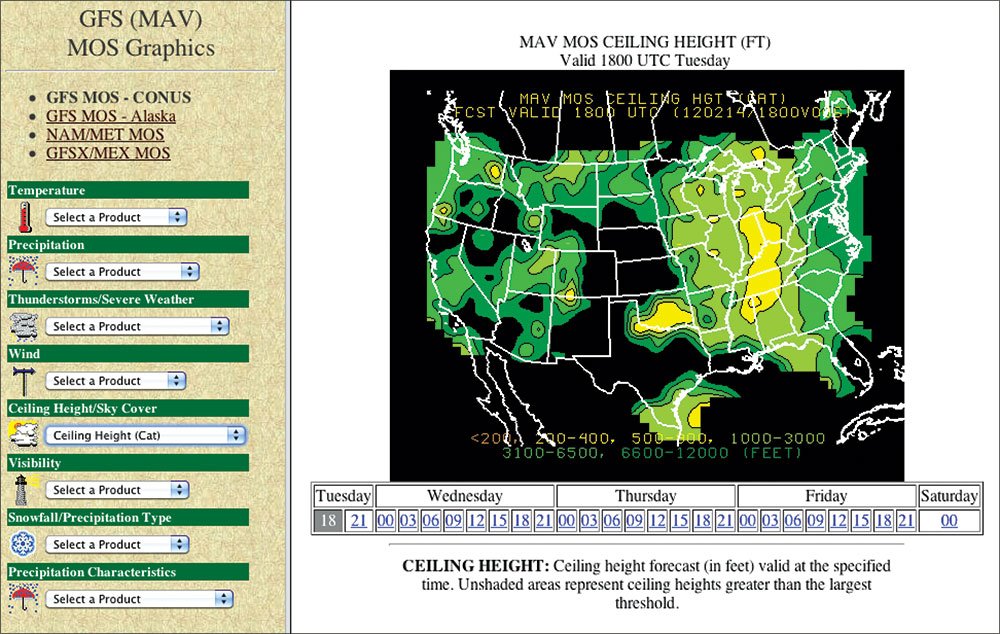
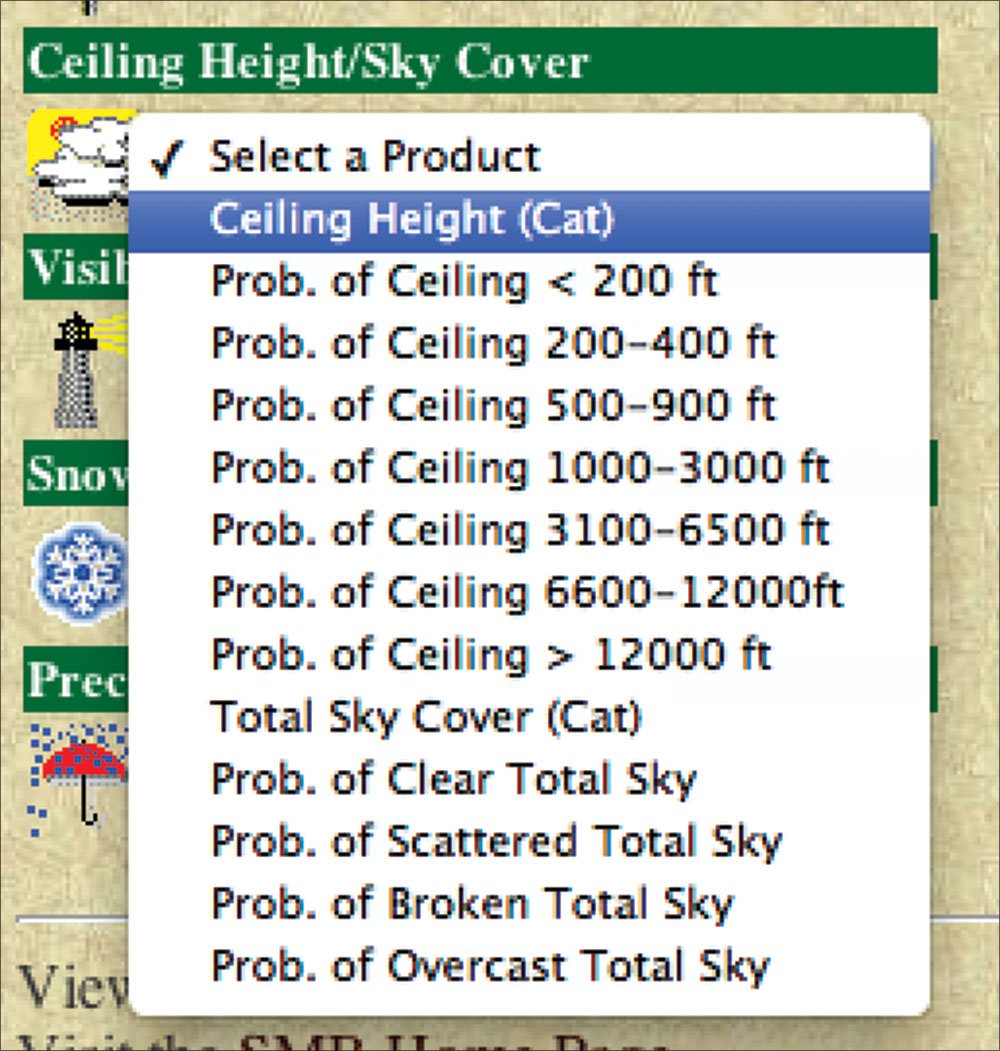
For ceiling, simply select the first choice under “Ceiling Height/Sky Cover.” Next, select the day and time of interest—up to three days in the future. This will display a categorical forecast for ceiling height using the scale at the bottom of the image. Other elements such as visibility can be displayed in a similar fashion.
Brown and yellow shaded contours on this chart represent a forecast of IFR, LIFR and VLIFR ceilings (very low IFR; see sidebar on page 18). Black areas outside of the shaded contours are what you hope to see along your proposed route indicating clear skies or ceilings greater than 12,000 feet.
Missing the Specifics
Suppose it’s the middle of the week and you are planning to fly from Greensboro, N.C., to Harrisburg, Penn., with a return on Saturday morning. Even though the weather is outstanding for your initial leg to Harrisburg, you have to be back in Greensboro by mid-day on Saturday.
The Weather Channel’s five-day outlook suggests highs in the upper 50s and low 60s, with mostly cloudy skies on Saturday. That’s fine for deciding which jacket to bring, but it doesn’t tell you much about ceiling height or visibility.
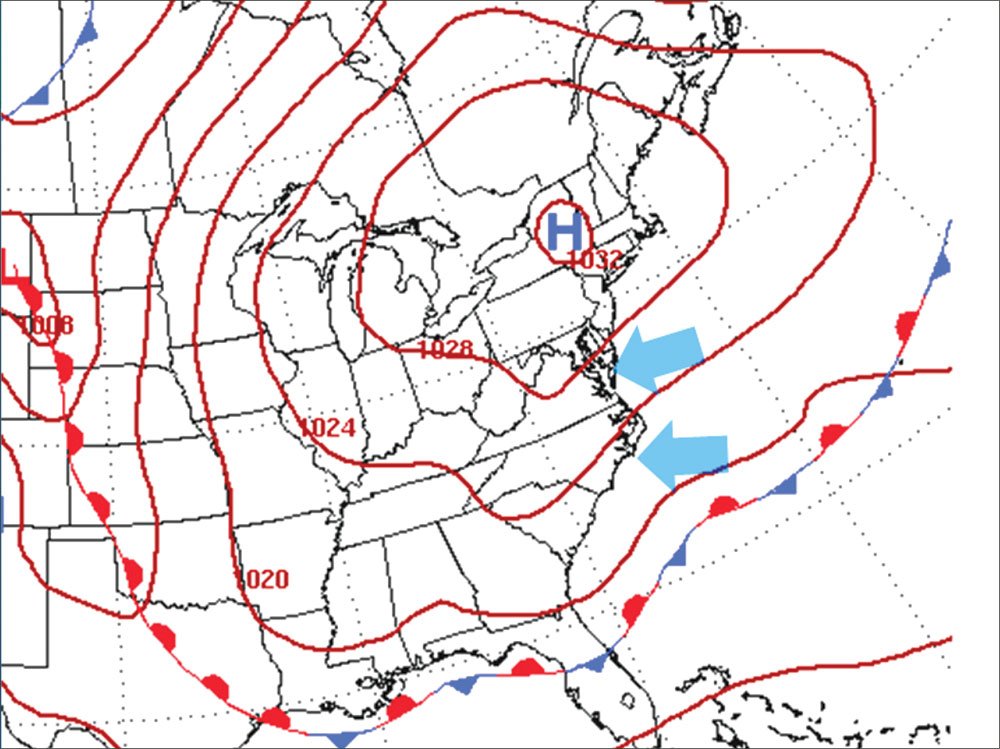
So we turn to the Day 4 prog chart from the HPC valid on Saturday morning (upper right). The forecast depicts a massive area of high pressure to dominate the eastern half of the country pushing any fronts well into the Deep South.
Without any fronts or areas of low pressure to get in the way, high pressure ordinarily equates to relatively clear skies and fair weather. This certainly doesn’t jibe with The Weather Channel’s five-day outlook. Is this just a bad forecast, or is something else going on?

Such a CAD
In this case, the Area Forecast Discussion (AFD) is useful to read (www.wrh.noaa.gov/zoa/cwa.php). This is a textual product written by forecasters who are physically located at the local weather forecast offices throughout the country. While not specifically a product created for pilots, they’re written in plain English (although they can get technical at times) and may help decipher the prog charts, especially for the long-range forecast.
The AFD written by forecasters in Raleigh, N.C., provides a good synoptic overview of why there may be clouds over a portion of the route on Saturday morning:
long term /saturday through tuesday/…
descent classical cold air damming event will be in progress at the beginning of this period. parent high should be anchored over new england due to confluent flow at 500 millibar. medium range guidance hinting at mid level trough approaching the region saturday. this feature should enhance overrunning of warm moist air over the stable cool dome at the surface. this may lead to more precipitation than earlier thinking. not ready to increase pop appreciably but if later model guidance remains consistent…higher pops and cooler temperatures would be warranted for saturday.
The forecaster describes a classic cold-air damming (CAD) event that is expected to be in progress on Saturday morning. Referring back to the Day 4 prog chart, this means that clockwise flow around the high pressure in New England will keep the low-level winds out of the east and northeast for a good portion of the Mid-Atlantic. This will bring in relatively cool, moist air off of the Atlantic. This dense air will tend to hug the surface and become wedged (dammed) against the Appalachian Mountains with nowhere to go.
Depending on the ground temperature and moisture content in the soil, a CAD event can engender low IFR conditions over a widespread area. With stable conditions and no vertical mixing in place, gentle upslope flow from the east and northeast with cool and moist conditions at the surface will allow a widespread, low, stratus deck to form, and may even produce areas of precipitation as suggested by the Raleigh AFD. Unfortunately, the AFD doesn’t elaborate on the details of the IFR event.
MOS to the Rescue
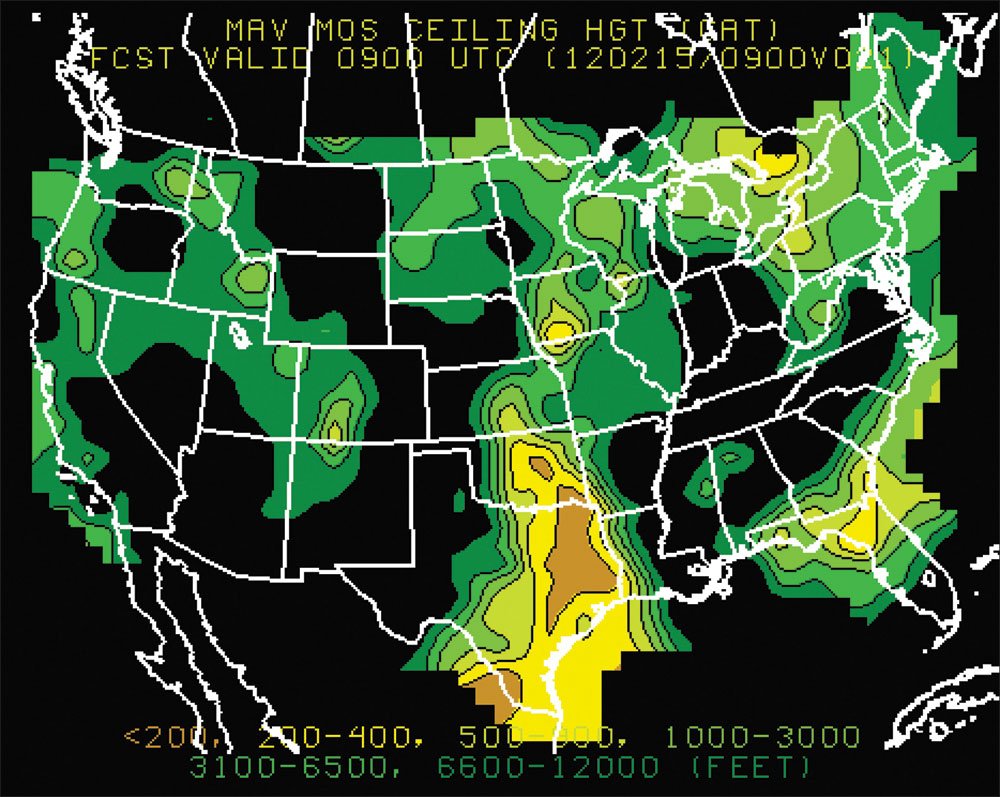
This is where MOS guidance can really shed some light. The categorical ceiling height MOS forecast for Saturday morning (page 17, lower) shows widespread clouds over most of the Mid-Atlantic and Southeast—a direct result of the CAD event. Much of the route between Harrisburg and Greensboro is forecast to be in the IFR and low IFR categories, implying ceilings as low as 200 feet.
Of course, this is a forecast that could easily change for the better over the next day or two. But, if you need to make a somewhat informed decision on your IFR return, the graphical MOS guidance integrated with the prog charts and area forecast discussion is invaluable.
When Low IFR isn’t low enough
Many online sources including the Aviation Digital Data Service (ADDS) will routinely depict the weather graphically using four distinct categories that should be familiar to all pilots. ADDS, for example, uses color codes with green for VFR (Visual Flight Rules), blue for MVFR (Marginal VFR), red for IFR (Instrument Flight Rules) and magenta for LIFR (Low IFR).
However, about 10 years ago, the NWS introduced an additional category, namely, VLIFR (Very Low IFR) to describe ceilings less than 200 feet and/or visibilities less than statute mile. The NWS considers this new category a significant threshold for safety from a forecast perspective, given that these forecast conditions would preclude dispatch or release to the airport as a destination or alternate for most operators. Even if you could dispatch, you might need Cat II/III authorization and a matching approach to arrive.
If you were planning a flight to the Texas Gulf Coast at the time in the upper chart here, it’s quite likely you’ll be shooting an approach to minimums—or maybe flying a missed for real. But it’s likely you’ll have several rock-solid alternates in central Texas. The second image shows that just six hours later, getting in anywhere in eastern Texas is dubious. If that’s your likely arrival day and time, you’d better be tankering a lot of extra fuel.
The VLIFR information is a bonus of MOS charts. VLIFR is a category that is not ordinarily distinguished from LIFR on most online sources. —S.D.
Scott Dennstaedt is a CFI and recovering meteorologist. His website is avwxworkshops.com.


