
Perhaps you’ve heard the term “nowcasting.” The American Meteorological Society defines this word as “a short-term weather forecast, generally for the next few hours.” Pilots from all backgrounds are likely to recognize the immense value of this topic. In this article, we’ll talk about some down-to-earth techniques for how to accomplish nowcasting, without a lot of complexity and jargon.
It’s not entirely clear where exactly the term “nowcast” originated. But it began appearing in meteorological literature during the 1960s. New satellite systems, modern radar networks, and improved data communications led to renewed interest in the concept during the following decade. The growth of severe thunderstorm research and the development of NEXRAD in the 1980s and high-profile events such as the Olympic Games in Atlanta carved out nowcasting as its own special branch of meteorology.
Poor Man’s Techniques
A sort of informal nowcast has always been available based on simply looking out the window and making small changes to what is observed, thus the term “now” in “nowcast.” This has long been the basis of the early days of aviation forecasting, when DC-2s and Boeing 247s roamed the sky. However this sort of forecasting is based heavily on intuition and extrapolation, and not necessarily on sound meteorological principles.
Extrapolation was one of the earliest modern techniques, and if you find obscure forecast books from the 1940s, they lean heavily on this method, with extensive chapters describing extrapolation methods for all purposes. While numerical models have largely eliminated extrapolation, it still remains useful for difficult problems. I used this in the early days of NEXRAD, often drawing directly on the PUP workstation screens with a Vis-A-Vis marker and using a scrap of paper to project the motion of storms and outflow boundaries and estimate their arrival times. The NEXRAD storm tracking algorithm uses an extrapolation method for storm-cell projections based on the storm centroid, and TV weathermen often draw this data on the screen, showing a list of when various towns will get hit.
The extrapolation technique can also be used on weather analysis charts to project when a front will arrive. Up until 10 years ago it was possible to beat the accuracy of forecast models by doing this sort of poor man’s projection, but today’s mesoscale models like the HRRR have improved so much that they’re about on par with extrapolation. If you don’t have access to mesoscale models, perhaps due to operating out of far-flung bases in Asia and South America, then pen and paper extrapolation is still highly useful for tracking and forecasting fronts up to six hours ahead.
Assessing the Sky
A simple glance at the sky tells a lot about what’s going on. When filling out the DD 175-1 Flight Weather Briefing form used by the Air Force, also known as the “Dash One,” I’d often first just take a look out the window to see what was happening locally. Pertinent observations include identifying what cloud forms exist, whether they’re in one particular area of the sky, the type of vertical development in those clouds, and any unusual conditions seen around the horizon.
In the same manner, it’s helpful to keep your eyes open as you head out to the ramp and view the sky as an array of signals and indicators, rather than just scenery for the day ahead. Of course, to maximize what you can get from looking at the sky, it’s important to be familiar with all the different cloud forms. There are 10 principle cloud types, like cumulus and cirrus. But there are also 15 cloud species, nine varieties, 11 supplementary features, and four accessory clouds.
I would advise you to get familiar with those ten principle cloud types: cirrus (Ci), cirrostratus (Cs), cirrocumulus (Cc), altocumulus (Ac), altostratus (As), nimbostratus (Ns), cumulonimbus (Cb), cumulus (Cu), Stratus (St), and stratocumulus (Sc). This knowledge is absolutely essential in meteorology and will serve you well in aviation. The types are used often in METAR code forms.
The other classifications are good to browse through and learn, but there is no need to commit their names to memory or to dig too deeply. You needn’t pay much attention to purely visual cloud forms like “intortus” (entangled forms), but clouds representing a distinct process are worth deeper study.
For example, castellanus is a species occasionally seen on altocumulus clouds. These have always been coded in airways and METAR reports as “ACCAS” and may indicate mid-level destabilization and the erosion of a mid-level capping inversion or “lid.” For this reason they are often associated with thunderstorms later in the day.
You can learn all about these cloud forms by searching the web for “International Cloud Atlas.” This will take you to a website operated by the World Meteorological Organization that has photos and extensive information for you to review.
If you dig deeper you can find the downloadable PDF files for the 1975 and 1987 printings of this atlas. These documents were kept at every federal observation site. The hard-copy documents might be easier for some users to use than paging through a website. When reading these references, focus on paragraphs that discuss what processes might be going on in the cloud. This is the heart of a cloud atlas, and “how can I apply this to a forecast” is a good question to ask as you go through the material.
Satellite Imagery
As you get increasingly familiar with cloud types, their significance, and other meteorological basics, you can put your skills to use working with satellite images. This tool is essential for all forecasting activities, especially nowcasts.
It’s especially important to seek out the best satellite imagery you can get. Satellite data has improved tremendously, and the images we get in 2023 are far better than what we used to work with in 2003. Not all sources of satellite data are the same, and there are still sources that continue to disseminate terrible, low-resolution photos, or images that are poorly georeferenced. So it pays to shop around regularly and bookmark websites that are useful.
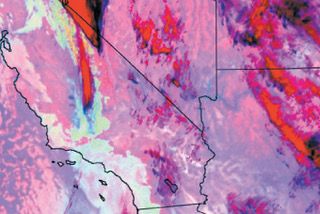
To give you an example of what you should be looking for, point your browser to College of DuPage at weather.cod.edu/satrad. Initially you will see a large infrared image of the United States. Using the menu on the left, you can click on View Sub-Regional Sectors to zoom in on your area of interest.
If it’s daytime and it’s not overcast, I strongly recommend clicking on “True-Color” at the bottom left. If you combine this with a zoomed sector for your location, you can get the best of what the modern GOES satellite offers. If you click on the “Product Overlays” button at the top left of the image, you can bring up a menu at the bottom and under “Mapping” you can add ARTCC Zones, Counties, Interstates, Station IDs, and more. Now this is how forecasting is meant to be in the 2020s!
It’s important to be aware of whether you’re using visible, near-infrared (NIR), or true infrared imagery. Visible imagery and NIR are only available during the daytime, and these products go dark at night. At night you will be using infrared imagery, which is built mostly on radiation of long-wave infrared imagery from cloud tops. Infrared imagery is sensitive mostly to middle and high-level clouds (clouds starting with alto- or cirro-) and large convective clouds. So it will do a bad job at detecting clouds like fog, stratus, and fair-weather cumulus.
Of course fog and stratus are important to night fliers, so I would advise switching to multispectral products, which will give you a pair of “night vision goggles” of sorts that will detect most clouds. The one you will want is usually called NT Microphysics or Day/Night Micro. You can find it at the College of DuPage site above under RGB Color Products. I use it often!
Surface Data
Another source for nowcasting is the array of METAR surface data available across North America. This data not only provides information for which runway is in use, crosswinds, and whether the airfield is above minimums, but also provides information on instability, air mass trends, and forcing mechanisms in the environment.
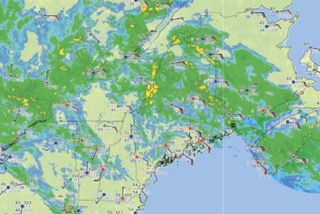
The best source for this is probably the Aviation Weather Center METAR display at aviationweather.gov/metar. This gives you a weather chart with current weather plots. Use your mouse and the scroll wheel to zoom in on your area. Again, a menu is available that lets you add highways, counties, ARTCC boundaries, and more. You can also add radar mosaics. Low-resolution satellite data is also available, but I find the radar overlay to be of more use. Also note you can click on stations to get the full METAR report.
A list of ways that you can use this data is too large to cover in the space we have available. We’ve touched on some of these techniques in past issues, such as in the May 2021 and December 2022 issues of IFR. Definitely check them out. However we can give you a few basic rules of thumb.
Gusts are probably underrated as a nowcast indicator. They indicate that the difference between wind speed peaks and lulls is 10 knots or more. This indicates that turbulence and mixing processes are occurring. This is usually caused by instability in the layer in which it’s occurring. The most common causes are strong solar heating at the base of the layer, or cold air advection at the top of the layer, often in the lowest few thousand feet AGL. It may also be a combination of the two. Other causes are from convective downdrafts, such as from virga and thunderstorms. No matter what the cause is, when gusts are present, expect turbulence near the surface.
By examining the wind flow for patterns you can often find convergent lines, where the winds seem to converge on a point or an axis. These patterns are especially useful in the summertime for finding likely areas of thunderstorm initiation. Even during the springtime along active drylines, I find that substantial convergence is a good indicator that storms may occur, while poor convergence is associated with weak convection and “forecast busts.” This is yet another underrated indicator.
Radar
Radar’s instantaneous scan of precipitation fields helped jumpstart some of the early nowcast techniques back in the 1980s. Most of these techniques circle back to knowledge of radar tools and the behavior of convective weather. For example, we know that most thunderstorm echoes are first detected at about 15 to 20,000 feet MSL, so it’s essential to use composite reflectivity for thunderstorms detection. Since it integrates all radar tilts, it gives us a 15-minute jump on thunderstorm development, compared to using typical base reflectivity products.
While you might think of radar being a tool to track storm cells, all radar sites offer wind profiles. You can see them by going to a good radar website like weather.cod.edu/satrad/nexrad. At this website, just select your closest radar site and choose VWP (Velocity Wind Profile). Assuming there are enough scatterers, you will see a near real-time view of winds, with the vertical scale calibrated in MSL. Yellow and red plots indicate low confidence in the data.
Models
Finally, models are coming into their own as useful tools for nowcasting. I would have never said this 20 years ago, but mesoscale models are now vital for an accurate nowcast. The supercomputers that NOAA/NCEP ran in 2003 had 7.3 teraflops of CPU power and 1.4 TB of memory, but now run at 10,000 teraflops with a thousand times the memory.
These systems are so fast that we are now solving forecast problems by running forecasts many times over and identifying the best solution using statistical methods, rather than simply running a model in one shot. These models are still not good enough to track individual storms or even forecast storm clusters reliably (the NSSL CB-WOFS project is working on this), but they are fairly good at handling fronts and other features with large-scale structures.
As a pilot, you can get access to all these tools by seeking out the HRRR, or the High Resolution Rapid Refresh model (soon to become the RRFS). These charts are available at www.pivotalweather.com. They provide useful hour-by-hour products for pilots such as cloud cover, forecast radar, winds, and freezing rain potential. For extra HRRR products, go to rapidrefresh.noaa.gov/hrrr/HRRR to get ceilings, visibility, aviation flight rules, and dozens of other fields.
And regrettably we’ve run out of space. But the story does not come to an end. Nowcasting is just one small part of operational forecasting itself, and all the principles and techniques blend together. In months ahead, we’ll cover more topics that not only stand on their own but will help you become a better nowcaster.
That said, none of this is a replacement for a proper flight weather briefing with official forecasts. However it’s always worth having an ace card in your hand, especially when it comes to critical information, and now you have a few new tools at your disposal when the weather isn’t quite looking like you had expected.
Tim Vasquez served as a career Air Force meteorologist as well as a storm chaser, a university textbook author, and a programmer. What’s his next project? Who knows? But you can catch his twice-weekly forecast show on YouTube at “Forecast Lab.”


