
On a warm summer afternoon, a two-ship flight consisting of a Beech A-36 Bonanza and a Piper PA-31 Navajo lifted off from Newport, Rhode Island. One made it through a looming storm; one didn’t.
Short Trip
The two airplanes made a gradual right turn to the southwest out over the grayish- blue waters of Rhode Island Sound.
Aboard the Navajo was a 70-yearold real-estate developer specializing in high-end properties. He built his fortune designing homes for New York celebrities and owned several restaurants. His 70-year-old wife and their 22-year-old grandson, a Georgetown University student, were aboard. At the controls was a 47-year-old commercial pilot hired by the developer. He was instrument-rated with single and multiengine privileges and had accumulated 3000 flight hours. The aircraft owner was a former pilot but no longer flew.
A charter pilot from the same company flew the Bonanza, and aboard was the developer’s granddaughter, returning to Long Island after finishing her prep-school term. Both planes were carrying plastic tubs packed with her belongings.
This two-ship flight was to cross the 56 miles from Newport to East Hampton Airport, on the far eastern end of New York’s Long Island. Usually, this was a quick 20-minute flight, but the western horizon was dark with the gray mass of a storm. The Bonanza pilot reported that the accident pilot and the owner had discussed the weather for an hour before departure. However, the FAA had no record of an official weather briefing, and no flight plan was filed. A weather advisory was already in effect half an hour before takeoff.
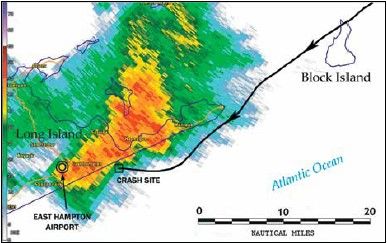
The plan was to fly VFR southwest to the Sandy Point VOR on Block Island, then turn west and follow the coast to the East Hampton Airport. Shortly after takeoff, the accident pilot talked to Providence departure, who advised them that there was a “bad storm” over their destination. Heading southwest toward Block Island, the Navajo with the developer and his wife moved ahead and took the lead.
Approaching Long Island, a dark, menacing scene filled the windshield. A powerful thunderstorm was covering much of the Hampton area. The gray, diffuse rain core blotted out the view of most of the island, and a broad, dark shelf cloud hung over the coast.
The Navajo, approaching the storm’s leading edge, checked in with East Hampton Airport tower, reporting he was five miles out and at 500 feet and “coming in below” the thunderstorm. “Doesn’t look like there’ll be an issue,” he said to ATC. For undetermined reasons, the pilot decided to fly the Navajo directly toward the airport traffic pattern, taking a course that penetrated the storm’s core head-on. Nothing more was heard from the airplane.
The Bonanza, following about two minutes in trail, talked to air traffic control and vectored clockwise around the storm. The airport was beginning to emerge from the storm’s backside by this time, and the airplane landed uneventfully.
The Navajo wreckage was eventually located one mile off the beach in 50 feet of water. The fuselage was broken into multiple pieces, and both wings had separated from the fuselage at the wing root. The airplane, equipped with a Garmin MX20 MFD and a Garmin GNS 530 GPS, could display weather information. However, with all the electronics damaged and submerged in saltwater, no data could be retrieved, and it was unknown what the pilot was seeing.
The crash sparked a wrongful death lawsuit filed by the grandson’s sister against the developer’s $150 million estate and the charter services operator. The case argued that the pilot and the aircraft owner “knowingly and intentionally flew the subject aircraft directly into the most dangerous depicted weather, rather than diverting to a different airport or altering the flight path to the destination.” The lawsuit is still in litigation.
A Weather Perspective
The NTSB investigators set to work during the weeks after the accident. An astute witness had taken a series of photos of the storm just ten minutes before the crash showing many details of the storm. (See the photograph on previous page.) Among these features was a large, turbulent shelf cloud with ragged elements on the underside. This is a classic presentation of a forward propagating convective system driven by a large outflow region.
The darker areas of the photo correspond to the area underneath the storm updraft itself that had tops of 47,000 feet according to FAA radar. These areas often have frequent cloud-to-ground lightning. The brighter regions beyond the dark region represent the rainy downdraft.
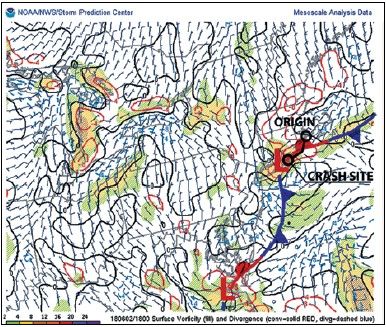
The storm itself originated from eastern Connecticut and was moving directly southward. The weather charts
showed an upper-level disturbance and cold conditions aloft, with a frontal system moving southward out of New
England and New York. Analysis of the weather field showed strong vorticity and convergence over Long Island Sound as the thunderstorms crossed this region. It was fueled by a small but potent frontal low centered on New York City.
To understand this better, consider the cold air aloft flowing southward out of Canada. This air tends to be colder than usual. Meanwhile, at the surface, winds may be out of the north, but there’s still significant heat and moisture. Temperatures were in the low 80s across Rhode Island, with dewpoints in the upper 60s. These are quite high for the northeast U.S.
The definition of an unstable air mass is cold air overlying warm air, with a rapid decrease in temperature per unit of vertical distance. When temperatures fall rapidly in the vertical, the air mass is unstable.
This is compounded further by high dewpoints, making it possible to convert the instability into kinetic motion through convective updrafts. Thunderstorm convection rises vertically to redistribute the heat. Putting warmer air in the upper troposphere and bringing cool brisk air to the surface relieves the imbalance and stabilizes the atmosphere.
Storm Scale Weather
The powerful thunderstorm that moved across the Hamptons was manifested by a cumulonimbus cloud containing an updraft. This is a plume of vertical motion fed by warm low-level inflow that is moving into the storm. The updraft represents the conversion of
instability into vertical acceleration—the stronger the vertical movement, the greater the potential for severe weather. The measure of stability, CAPE, is directly correlated to updraft vertical velocity. Crisp, solid-looking cumulonimbus towers are also associated with strong updraft vertical velocity.
As precipitation develops, a cold downdraft descends to the surface. The entrainment of rain, graupel, hail, and ice accelerates it even faster toward the ground. This downdraft spreads out horizontally as outflow producing cool gusty winds that we associate with storms. In very moist, tropical weather regimes, these storms tend to have diminished downdrafts and outflow, while storms with dry air aloft are likely to produce strong downdrafts.
The storm that downed Delta Flight 191 in 1985 (https://tinyurl.com/Delta- Flight-191), was associated with an intrusion of dry mid-level air, a rare occurrence for Dallas in the summer. This produces strong evaporative cooling of downdrafts.
Likewise, the storm in Long Island in our case study was associated with slightly drier air moving southward from Canada in the middle troposphere. It wasn’t strong enough to produce microbursts and downbursts, but the outflow and its interaction with the environment were strong enough to create strong turbulence. The Bonanza pilot reported having to slow down due to the amount of turbulence ahead of the storm.
Meteorologists weigh storms according to the balance between in-flow updraft energy and downdraft-outflow energy. Such storms are described as inflow-dominant, balanced, or outflow dominant. Weak outflow dominance is probably the most common type, especially in the summer in the southeast U.S. Updrafts move several miles in a different direction and re-develop, causing what’s known as a multicell storm cluster.
These are also called “popcorn storms.” Since the new updraft location tends to pop up in random places, it’s hard to forecast precisely where new precipitation will develop. Forecasting them is a bit like playing “whack-amole.”
In much more dynamic weather situations where dry air aloft is a factor, storms take on strong outflow dominance. This means that powerful outflow winds surge out from the storm, producing gusty winds or even damage. These winds are hazardous to aircraft in the local traffic pattern because they contain vortexes and rapid airspeed changes.
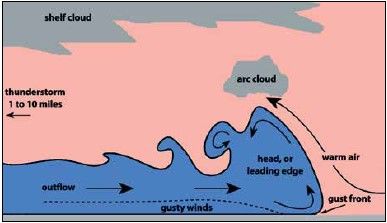
We can plot the different parts of a typical outflow wind as a vertical crosssection diagram (shown on previous page). This shows the outflow as a broad river flowing away from the storm. Its depth ranges from a few hundred to a few thousand feet. Frictional effects and overturning produce gusty winds near the ground. At the leading edge, we find a gust front, where the surface wind changes suddenly.
While we can’t know exactly how all these elements were configured underneath the storm, the NTSB suggested that the accident airplane lost control while flying along the top of one of these outflow surges or after entering the precipitation and downdraft area.The sequence in which the Navajo lost control is unknown, but a stall, loss of control, or structural failure were the most likely culprits. The heavy weight of the aircraft also likely degraded the airplane’s performance.
Lessons for Safety
The first rule is never to fly into a storm without dedicated onboard radar equipment or, at the minimum, a sfericks system. This is something we’ve previously suggested. During all the years that I’ve spent combing NTSB reports for weather accidents, by far, the most significant cause of fatalities are pilots taking a risk and flying into storms without the proper tools. The fact that there are so many of these reports means that many pilots are still assessing storms as benign and manageable when they are not.
One of the additional rules we often repeat is that satellite and ADS-B weather radar products are not designed for threading your way through a storm. During the time it takes to construct a radar mosaic, queue it for distribution, and send it to devices, the storm can quickly shift up to 10 miles. In a recent weather accident article, we highlighted a case where a storm was 30 miles from its last reported position. These displays are great for getting the big picture, but small-scale details need to be thought of as outdated. They’re best for determining generalized trends of a storm.
At the time of this accident, the New York City NEXRAD radar was down 15 hours for maintenance. Neighboring radars like Boston, Albany, and Fort Dix were used to fill the gap. Storms in the New York City area were not well sampled, suffering from high beam altitudes and beam broadening effects at long distances. This can significantly affect radar mosaics and present a storm as weaker than it is. These effects start to become significant at about 80 miles from the radar, close to where the East Hampton storm was located in relation to the Boston radar. It’s yet another reason why having airborne radar is better.
And if you need help, talk to the controller. They have radar displays with short latency. It’s particularly telling
that in our case study, one aircraft coming in on the same track talked to the controller and added some margins
for safety. The result was a route around the storm and an uneventful landing. The other aircraft tried winging it and didn’t make it, however, examples like this are rare.
Know your tools, select them judiciously, and use the appropriate ones as needed. Thunderstorm safety guidelines in the AIM are built on a solid foundation of lessons learned from thousands of thunderstorm accidents and mishaps over the decades. All of this will go a long way towards keeping you safe once the wheels are up


Great article, very helpful! I had no idea such long planned NEXRAD outages would occur; I’ll double check on my future XC’s in the Notams.
Maybe I’m a little too cautious for some, but even with “the right equipment” I would have waited this one out, especially given that it was such a short flight and there would have doubtless been a better time to go.
Just another example of get there itis, a fatal disease.