
Every summer and autumn headlines cover at least one major hurricane approaching the coast. You’re probably not planning to do any pattern work in a hurricane, but it’s quite common for instrument pilots to skirt the edges of these storms. A few airline and corporate pilots go right over the top. Hurricanes and tropical storms are a big topic at FBOs and in the flight deck when August and September arrives, and if you have a plane tied down in the path, you’re well aware how stressful that can be. So let us regale you with some facts, trivia, and essential information from the perspective of a veteran aviation forecaster.
We’ll specifically discuss hurricanes and issues relevant to the United States. But for those of you overseas, keep reading anyway. Whether you’re in Australia, Japan, or Bangladesh, a hurricane, typhoon, or tropical cyclone are all exactly the same thing. The underlying physics is identical, so there’s plenty to learn here. The only differences boil down to the interactions with land masses and ocean currents, and of course the reversed direction of rotation south of the Equator.
Latent Heat Fuel
As with many convective weather systems, the hurricane is powered by the release of latent heat. This is thermal energy released into the atmosphere from a phase change of matter—in this case, condensation. Condensation occurs when water vapor changes to rain, graupel, snow, or ice as a result of cooling processes such as lift. The combination of heat and moisture from ocean surfaces provide the rocket fuel needed to get hurricanes going. In fact one of the key ingredients in hurricane formation is a sea surface temperature of 26°C (79°F). This provides both the sensible heat, moisture, and evaporation rates needed to supercharge the low levels of the atmosphere with rich air.
At that point, all we need is a favorable environment. Key factors boil down to Coriolis force and shear. Perhaps you noticed that weather systems are longer-lived the further they are from the tropics—Coriolis force from the Earth’s rotation is why. On the Equator, low pressure can’t last more than hours before air rushes in to fill the void, but at more temperate and polar latitudes, the Coriolis force opposes the restoring pressure gradient force. Above about 10 degrees, this will be strong enough to allow pressures in a hurricane to continue falling.
Vertical shear, the vector difference between lower and upper tropospheric winds, is often beneficial for storms and small weather systems. But for tropical weather systems strong shear can destroy the system. Ideally there should be under a 20-knot difference between the lower and upper troposphere. This is largely why we don’t see many hurricanes in the South Atlantic, where shear is usually too strong.
Once storms form in a favorable environment, the warm moist air and release of latent heat helps drop the pressure. Thus, air flows in and converges, producing more storms. It doesn’t take much, so we get a chain reaction of more storms and lower pressures.
Terminology, Definitions
Hurricane intensity is based on maximum sustained wind speed. For sustained wind speed, we look strictly at the one-minute (U.S.) or 10-minute average wind speed. Gusts are never used except in public warnings. Wind speeds are assessed with dropsonde readings, anemometer data, and satellite measurements. The “Dvorak technique” is a common technique using satellite data to assess the winds.
Now for the terminology. What we call a hurricane in the Americas is known as a typhoon in East Asia and a tropical cyclone in Australia and the Indian Ocean (the word tropical cyclone is also a blanket term for all well-developed weather systems worldwide). These well-developed systems have a wind speed of 64 knots or higher. They evolve from a tropical storm (TS), which is a designation given to storms with winds of 34 to 63 knots.
The next step down the ladder is the tropical depression (TD), with winds less than 34 knots, organized storms or showers, and a closed circulation. Below that is a tropical disturbance, similar to the tropical depression but with no distinguishable low-pressure center. Our next weakest disturbance, the easterly wave or tropical wave, is a wavelike disturbance that usually moves east to west in the tropics and is either dry or has disorganized showers and storms.
Many hurricanes had their first indications in one of these weak easterly waves, usually moving off the West African coast into the Atlantic. If conditions are favorable, those waves then progress up the scale to tropical disturbance, tropical depression, and so on. Once a hurricane or tropical storm is in the mid-latitudes and begins interacting with colder air masses, they begin converting to extratropical cyclones, which are the same things as “frontal lows” and no different from a weather system moving across Iowa in November. This occurs when they lose their warm core fueled by latent heat, and become powered by frontal temperature contrasts instead.
Full-fledged hurricanes are classified according to the Saffir-Simpson scale, developed in 1971 by Herbert Saffir, a structural engineer, and former NHC director Robert Simpson. This is sort of like the Richter scale for hurricanes. It classifies storms into five categories according to the wind speed. The weakest is the Category 1 storm, with sustained wind speeds of 64 to 82 knots, while the strongest is the Category 5 storm, with winds of 137 knots or higher. Before 2010, pressure and storm surge were also considered, but the scale now strictly uses wind speed, making it suitable for use worldwide.
Statistically, the most likely location in the United States to be hit by a hurricane is southern Florida, with the North Carolina barrier islands and the New Orleans area ranking a close second and third. However the entire Gulf of Mexico and Atlantic Coast is vulnerable. Hurricane Sandy and the much worse 1938 New England hurricane are examples of how strong storms can get up north.
Baja California and northwest Mexico are frequently affected by hurricanes in the late summer and fall, so check those NHC forecasts carefully if your flight routes bring you that way. The remnants frequently move into southern California and the southwest deserts at least a few times every year. This consists entirely of showers, overcast clouds, and lots of MVFR, though much of the wind field at the surface has been destroyed. Only one known hurricane has ever made it into the southwest United States, and that was in 1858 in San Diego and Long Beach. Let’s hope there’s not a second in our future, given how erratic the weather has been lately.
Structure
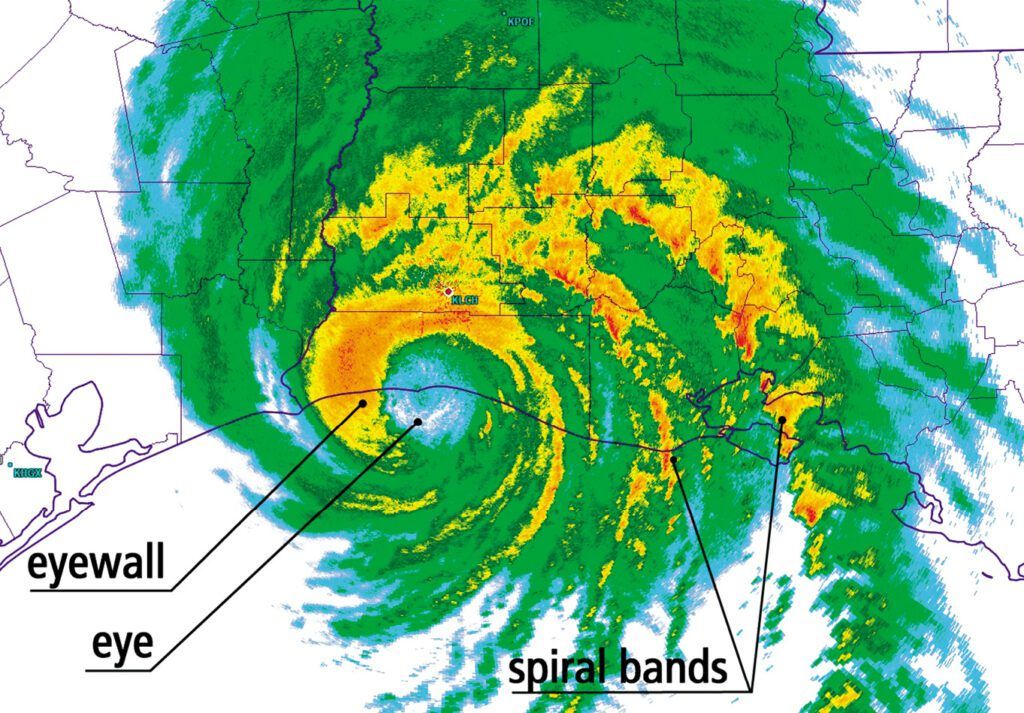
Tropical storms and hurricanes contain a spiral structure in which wind blows in a counterclockwise direction into the center of the storm. You’ve probably noticed this on satellite imagery, though what you see is actually the clockwise, anticyclonic outflow cirrus at the top of the storm. Radar images more accurately show the spiraling of wind into the storm.
The very center of the storm is the eye. Here the barometric pressure is the lowest, and it marks the location of a partial vacuum that drives the wind field around the entire storm. The eye is very well developed in a strong hurricane, and often measures 30 miles wide. Skies may actually be clear here with sunshine and light winds. In weaker hurricanes it is filled with clouds and stronger winds, and in tropical storms it is indistinguishable and can only be ascertained by a sudden wind shift and a rise in the barometric pressure.
Surrounding the eye is the eyewall. Again this is well developed in strong hurricanes, while in weaker hurricanes and tropical storms it is poorly organized or merged into the eye. The highest winds are found in the eyewall. Torrential rainfall and a few thunderstorms might be found here.
Working outward we find the spiral bands. These are bands of heavy rain divided by “alleyways” of lighter rain. On radar and satellite, they show a distinct spiral appearance. These extend about 100 to 200 miles away from the eye.
At the outer margins of the storm we find the outer spiral band: this is basically the spiral band that “leads” the front of the storm. Surprisingly these produce some of the most damaging tornadoes, as the atmosphere here tends to be highly sheared in the low levels and isolated storms that can form three-dimensional supercell structures are more likely, unlike near the center of the storm where cells are packed tightly.
So you should not only be looking for hazards near the eye of the storm. The storms in the outer spiral bands can look deceptively weak, and only close examination of the cells on radar velocity shows the compact tornadic circulations embedded within.
Aviation Hazards
Needless to say, damaging winds, severe convective turbulence, and heavy clear icing above 15,000 feet are the biggest hazards with hurricanes, and airfields will be completely out of service in anything but the weakest tropical storm. When I forecasted for the Air Force, all of our air bases had a relocation plan to move aircraft out of the path of a strong storm at least 24 hours in advance. A plan like this might also be wise if you have a plane parked near the coast.
Near the periphery of the storm, aviation activities are certainly viable, especially at locations that get grazed as the storm passes nearby. Ceilings will be your main problem. These are mostly dependent on the origin of the wind flow; in other words, look upstream. If these winds have a long trajectory for hundreds of miles across the interior of the continent, they will tend to bring dry air masses into the area at the low levels. This means that ceilings will generally be above 3000 feet, often closer to 10,000 feet or more.
If the upstream winds originate from warm ocean waters, low ceilings are much more likely, often 1000 to 2000 feet, falling at night and rising during the afternoon. This type of air mass is much more likely to be filled with scattered to broken showers.
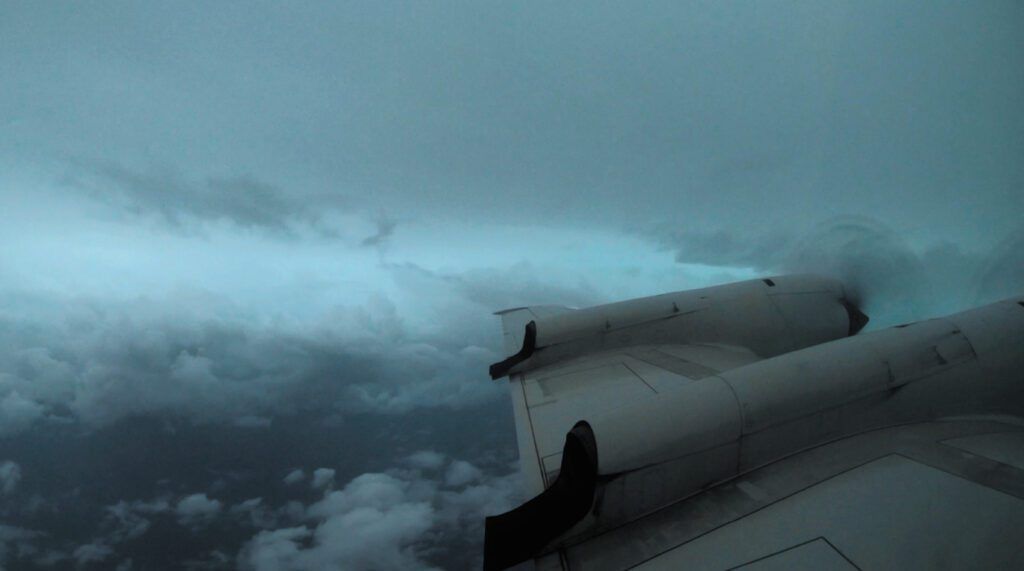
Regardless of the wind flow and air mass trajectory, the area will be covered by a large mass of outflow cirrus radiating from the center of the storm. This forms the overall “shape” of the tropical cyclone on satellite imagery. This cirrus will be broken to overcast, and may become quite dense, blotting out the sun.
Hurricanes that make landfall and weaken are still a hazard, because they transport vast amounts of moisture inland, especially within 50-100 miles of the center. Torrential rains, often heavier than radar indications suggest, are found hundreds of miles inland. Sometimes unexpected strengthening occurs. Tropical Storm Erin in 2007 weakened as it moved into Texas, then unexpectedly intensified to near hurricane force as it crossed Oklahoma, with sustained winds of 52 knots. This illustrates why you should never let down your guard until the storm has exited the region.
Forecasts
The National Hurricane Center is the sole authority for forecasting tropical weather systems in the Atlantic Ocean and the eastern Pacific. Their website at www.nhc.noaa.gov should be a mandatory stop on the Internet if you do a lot of flying in the Southeast or the Caribbean. The forecast track is updated several times a day and provides the best forecast by some of the best meteorologists in the country.
Should you wish to dig a little deeper, the website tropicalatlantic.com is a great stop. The top of the page will show any active named storms, and from there you can directly access all of the dynamical and statistical model data for the storm. This provides a range of possible tracks and helps illustrate the forecast uncertainty. You can compare this with official tracks to show the potential changes in hurricane movement. Each track is generated by a model or a model ensemble member, and each of these has its own four-letter code. All of the forecast tracks can be plotted and followed in Google Earth or directly on the website.
And for keeping up on satellite imagery, don’t rely on TV weather. There’s much better imagery at sites like Colorado State: rammb-data.cira.colostate.edu, which has the best real-time hurricane images anywhere on the Internet. You’ll get at least a dozen types of satellite imagery, plus amazing plots of wind field, intensity, and much more from model and microwave sensor systems. You just might find yourself wondering if meteorology rather than aviation is your calling.
Tim Vasquez was an Air Force forecaster and dealt with countless hurricane landfall situations in Texas plus several typhoons in Korea. He still continues to write books, develop software, and hosts a YouTube channel on weather.


