
Your favorite flight-planning website might conveniently calculate times and fuel burns at a most favorable altitude, but there are times when it’s likely to be dead wrong.

If I were crowned king, my first decree would be to abolish the official winds and temperatures aloft forecast, also known as the FBWinds. It’s an outdated product that’s fraught with problems. The problems get compounded when pilots unknowingly misuse the forecast.
I’ll never be crowned king, but you can learn the limitations of FBWinds and know when you might get burned.
Nobody At The Wheel
Every standard briefing, every DUATS session and all flight-planning packages (online or otherwise) that factor winds into groundspeed and fuel consumption use FBWinds. It’s also what you get on ADDS under “Official NWS FB Winds/Temps Aloft.”
But it’s critical to remember this forecast is automated. It’s not tempered by a human forecaster; it gets transmitted out over the wire without a single person looking at it. The data is generated every six hours by the North American Mesoscale (NAM) weather-prediction model. The winds and temperatures from the NAM’s forecast are interpolated to the official winds and temperatures aloft stations and altitudes. A textual bulletin is then constructed and transmitted to the world.
When the winds are light or the weather isn’t changing all that much with time along your proposed route, then your experience of actual winds won’t stray too far from the FBWinds forecast. Throw in the passage of an upper-level low or a cold front along your proposed route and you may get a serious surprise.
FBWinds have no amendment criteria; no matter how bad the forecast turns out, what you see is what you get until it’s replaced by a new forecast.
Spatial Resolution
Despite the NAM having a 12-km (6.5-nm) spatial resolution, the winds and temperatures aloft stations are spaced apart by 100 miles or more in most instances. If your route splits the difference between two stations that are 150 miles apart, you’ll use interpolation to get the winds and temperatures for various points on your route.
Simple interpolation can work out well in some instances, but given such a large distance, who’s to say that this interpolation is really representative of the conditions along your route? Temperature, wind speed and wind direction can often vary quite a bit within that distance and a simple interpolation calculation cannot capture the variation. (See Case Study One on the next page.)
This is especially true with the vertical resolution of the official forecast. FBWinds for the continental U.S. are forecast every 3000 feet up to 12,000 feet MSL. All levels 18,000 feet and above are pressure altitude and vary in vertical resolution from 4000 to 6000 feet through FL450. However, no winds are forecast within 1500 feet of station elevation (the surface) and no temperatures are forecast for the 3000-foot level or for any level within 2500 feet of station elevation. The NAM source data has a much higher vertical resolution, but you’ll never see it in the official forecast.
Temporal Resolution
All FBWinds forecasts have both a valid time and a “for use” period. Depending on the actual forecast product (six, 12 or 24 hours), the FBWinds are only truly valid at 0000, 0600, 1200 or 1800 UTC.
Suppose you are planning a morning departure with a route that takes you right over one of the FBWinds stations at one of the FBWinds altitudes, but at 1400 UTC. The most current FBWinds product available is the six-hour forecast from the 0600 UTC run of the NAM. This forecast is for use between 0800 UTC and 1500 UTC. So, you would use this bulletin to plan your flight.
However, the six-hour FBWinds forecast is only valid at 1200 UTC even though it is for use between 0800 UTC and 1500 UTC. Let’s say a frontal system is expected to pass through the FBWinds station an hour later, around 1300 UTC. Will the forecast winds and temperatures be accurate for your planned route? Because the forecast is valid at 1200 UTC, before the front has passed the station, there’s a good chance that the winds and temperatures at 1400 UTC won’t match reality. (See Case Study two on the opposite page.)
What To Do?
If you feel the need to complain about the accuracy of the official winds and temperatures aloft, send a letter to the FAA. That’s the organization responsible for how pilots use this antiquated forecast.
Until they give us something better, try the Skew-T, or at a minimum, recognize that errors can be significant when the product is used at times other than the valid time of the product. Moreover, errors can also be magnified when interpolating between FBWinds stations and between altitudes.
Scott Denstaedt is a former metrologist and a CFI. He teaches aviation weather online at www.avwxworkshops.com.
In the southeast U.S., it’s quite common to see the wind abruptly shift at some altitude between 3000 and 6000 feet. For example, a 200-mile flight during the morning from Greenwood, S. C., (KGRD) to Albany, Ga., (KABY) passes nearly midway between the Atlanta and Savannah FBWinds stations. The Atlanta winds valid at 1200 UTC are forecast to be 100 at 18 knots at 3000 feet and 280 at 26 knots at 6000 feet. That’s a 180-degree directional shift.
If your desired cruise altitude is 5000 feet, will that be a nice tailwind or an annoying headwind? The FBWinds don’t tell you where the shift will occur.
To the east of the route, Savannah is expected to have a similar wind shift with a forecast of 060 at 12 knots at 3000 feet and 270 at 31 knots at 6000 feet. Your flight planner might average this out and estimate the winds along your route to be 350 degrees at 22 knots at 5000 feet, for example. But that’s unlikely to be correct, and so is any time and fuel planning based on it.
A better approach is to visualize the wind shift with the Skew-T log (p) diagram. The diagram shown here is a one-hour forecast sounding near Macon, Ga., (KMCN). This solves all three problems with the FBWinds.
Macon is much closer to your route of flight and the forecast is valid close to the time you’ll pass through this area, so there’s less extrapolation. The Rapid Update Cycle (RUC) forecast model also provides a much higher vertical resolution of the winds. Using this diagram, it’s easy to see that the winds below 4000 feet are from the east and shift around to the west just above 4000 feet. In addition, the RUC is refreshed hourly, providing an up-to-date forecast of winds and temperatures at hourly intervals out to 18 hours in the future. —S.D.
A strong cold front at the right location can wreak havoc with the temperature forecast in the official FBWinds. For example, a 300-mile IFR flight during the morning from Rochester, Minn., (KRST) to Topeka, Kan., (KTOP) passes right over the Mason City, Iowa (MCW) winds aloft station shortly after departure. Based on the 0900 UTC surface analysis chart, a cold front is approaching from the northwest and is positioned just to the west of the proposed route.
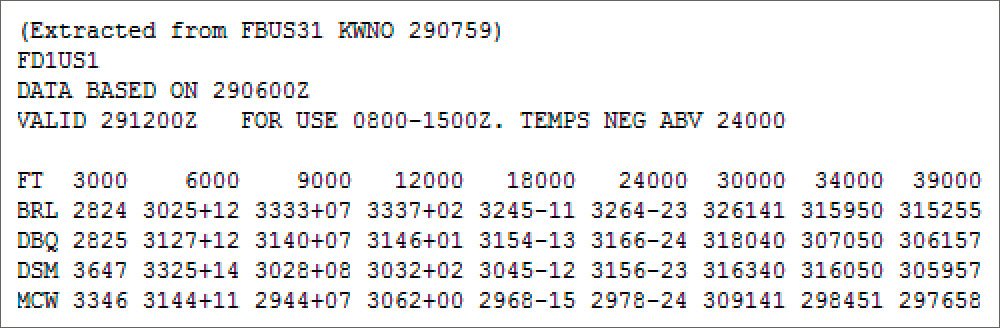
Shown here is a partial list of the latest FBWinds bulletin, including MCW located in the last row. Given cloud cover over northern Iowa, structural icing is a concern. Based on this forecast, the freezing level over Mason City is expected to be at 12,000 feet. Therefore, a proposed altitude of 10,000 feet should be sufficient to stay below any icing potential. That’s great, but the departure isn’t until 1430 UTC.
Here’s the problem: The FBWinds bulletin is valid at 1200 UTC, but it is considered “for use” between 0800 and 1500 UTC. With a strong cold front such as this, two or more hours can make a significant difference in the freezing level given a departure that is over two hours beyond the valid time of the forecast.
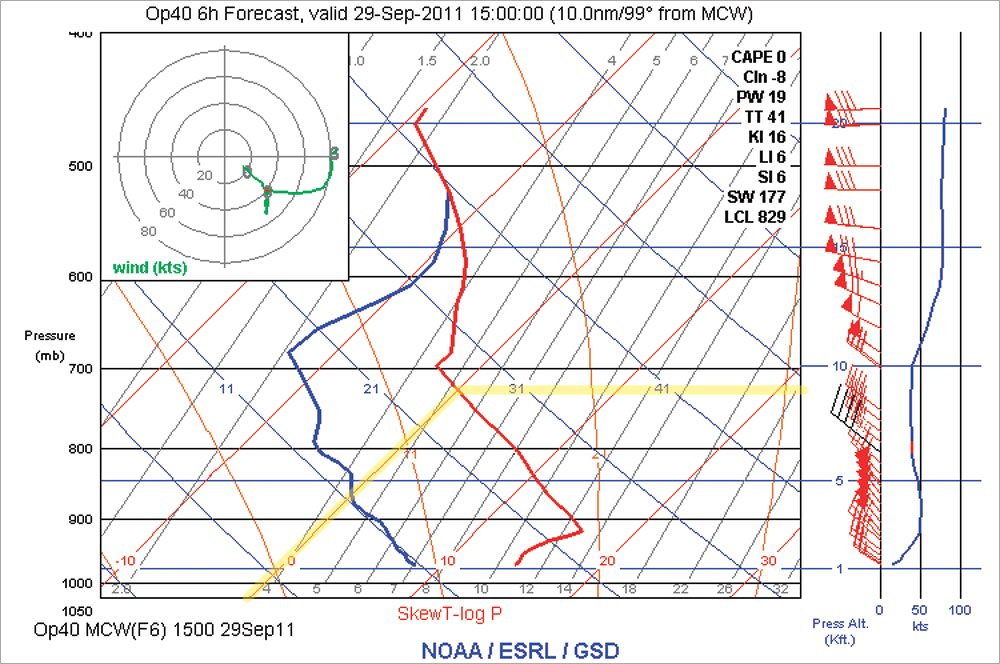
Instead, examine the temperature profile on a Skew-T log (p) diagram. Shown here is the RUC model one-hour forecast sounding for Mason City valid at 1200 UTC. The zero-degree isotherm is highlighted here in red for clarity.
Notice the forecast environmental temperature shown in red crosses the zero-degree isotherm around 12,000 feet MSL. This matches the temperature in the official FBWinds forecast which is also valid at 1200 UTC. So far, so good.
However, as the cold front passes through the Mason City station shortly after 1200 UTC, the temperature aloft will begin to plummet. The RUC model has a much better temporal resolution than the FBWinds forecast, given that it is refreshed hourly and provides hourly forecasts out to 18 hours.
In fact, the forecast sounding for Mason City valid at 1500 UTC shows the environmental temperature crossing the zero-degree isotherm around 9000 feet MSL. So where the closest time window on the FBWinds predict +7 degrees C, the RUC shows it’s more likely to be zero degrees. That could make a significant difference in your flight experience. —S.D.


