Pilots have to keep up with quite a bit of knowledge. There are regulations, procedures, chart symbology, various engineering disciplines, and many others. For some pilots, business skills have to be added to the mix. And on top of this, you’re expected to have a working understanding of meteorology. Sometimes your knowledge gets a bit hazy and things get forgotten. It’s understandable.
So it’s good to go back and revisit the basics occasionally, as this is where the foundation of knowledge begins. Fortunately in just a few pages, you can learn the basics of aviation meteorology. And you’ll be getting the details from an actual aviation forecaster—me. So let’s dig in.
Temperature
Temperature requires little explanation. At a physical level, we’re just measuring the kinetic molecular energy in the gas that makes up the volume of air. That’s all there is to it. It’s easily measured with a thermometer.
The main problem with temperature has always been instrument exposure. A lot of work has been done over the past 100 years to standardize temperature readings so that Pittsburgh isn’t measuring the temperature on top of an asphalt roof, and Bismarck isn’t measuring temperature on the side of a heated building.
By international agreement, temperature measurements are taken at a height of two meters (about six feet) above the ground. When you see a reference to “2 meter temperature,” that’s standard air temperature. The ground also must represent the surrounding terrain, and preferably be a large grassy area to help minimize effects from radiation and conduction.
Dew Point
Dew point temperature has a couple of different meanings. One definition states that it’s the temperature to which the air, if cooled, will reach saturation. Further cooling will produce visible droplets, which condense on saturation nuclei. This can include anything from microscopic dust to metal, leaves, and anything that’s in contact with the air.
Of course reality is a little more complicated. Condensation can occur at temperatures above the dew point temperature if pollutants like sulfur dioxide are common. Likewise condensation might occur well below the dew point temperature if no nuclei are available, which might occur in places like arctic regions.
Dew point also quantifies the absolute moisture content in the atmosphere, or the specific humidity. Specific humidity is the total mass of water we can extract out of a given volume. This is such a native, intrinsic property of air that this is what we feed to forecast models to represent moisture. Dew point is not the same as specific humidity, but it is almost directly proportional to it and easier to understand. Forecasters like working with dew point whenever we can.
Furthermore, dew point sheds light on what type of air mass is present. Low dew points, below 30-40 degrees Fahrenheit, are associated with deserts, polar regions, and the upper troposphere, while high dew points, of 60-70 degres and higher, are associated with warm oceans and tropical areas. So you can use dew point as a sort of tracer for where the air came from. If it’s September in New Orleans and the dew point is reported to be 40°F, you can assume that either a polar front blew in from the north, or a strong, dry high pressure area is causing air to mix downward from the upper levels of the atmosphere.
Relative Humidity
Relative humidity is another value that gives information on the moisture in the air. It indicates how close the air is to a saturated state. At 100 percent the air is saturated, though as we explained earlier, differences in atmospheric chemistry can cause saturation below or above this value. Haze is a prime example of this: you’re not seeing the actual smoke particles but the condensation of water that occurs on the pollution nuclei. In a heavily polluted area, this can happen at relative humidities of around 60 to 70 percent, meaning that visibility can remain low even after the sun has warmed things up.
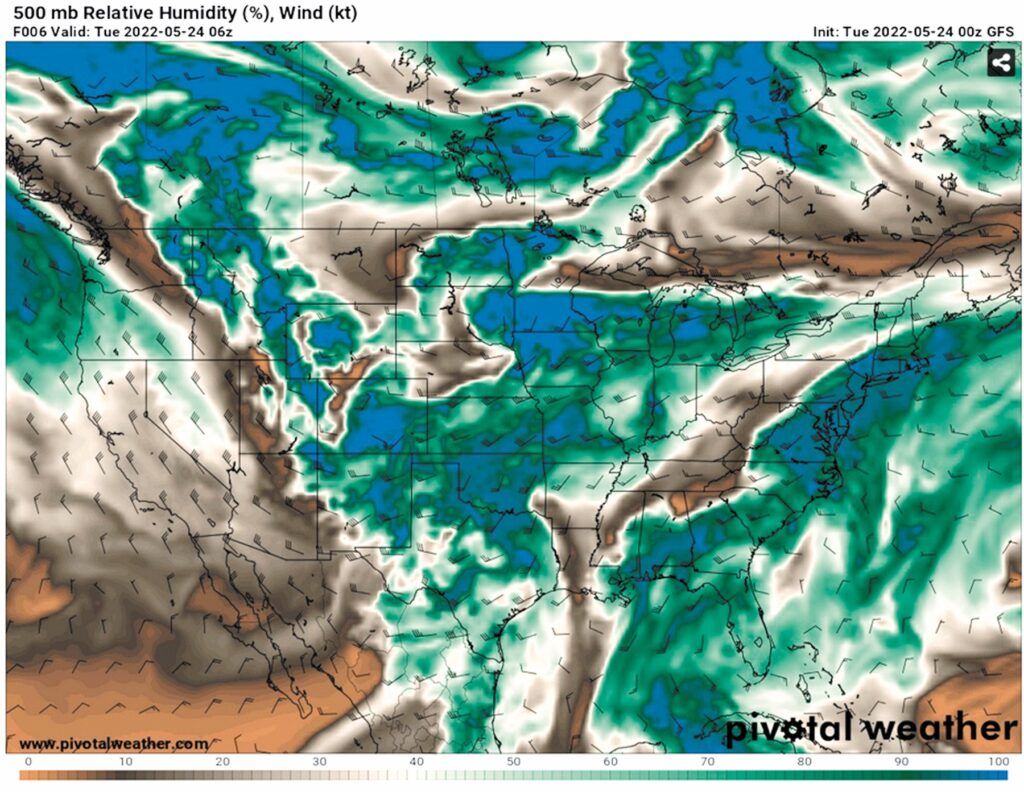
In meteorology, we use a 70 percent relative humidity figure as a threshold for the formation of clouds. This is why upper-level forecast charts often give relative humidity—we can correlate the patterns with cloud layers. The 700-millibar chart, located at an altitude of about 10,000 feet, thus gives information on the presence of altostratus, altocumulus, and convective clouds if we shade in areas where the relative humidity is above 70 percent.
Similar to the 70-percent-for-clouds rule of thumb used by forecasters is a temperature-dewpoint spread of five degrees Celsius or less (nine degrees Fahrenheit). When the spread is less than that, we can suspect that clouds might exist at that level. This rule of thumb is often used when working with Skew-T diagrams, as the temperature-dewpoint spreads at different altitudes can be immediately seen and measured on the chart (see IFR, October 2019 and March 2020 for more on Skew-T diagrams).
Remember that relative humidity is not an actual conserved property of the air mass because it changes according to the temperature. If the temperature goes up, relative humidity goes down. When the atmosphere cools, relative humidity goes up. Relative humidity is dependent on other variables.
When you go outside to fly in the morning and you find dew covering your aircraft windshield, the relative humidity is probably near 100 percent. The atmosphere feels damp, but the actual amount of water in the air, or its specific humidity, has probably not changed at all over the past day. By cooling the air at night, we’ve made it feel more humid and made it easy for water to condense on objects.
Visibility
There are a couple of expressions of visibility. Alone, “visibility” simply means the maximum distance at which a familiar object can be seen and identified. “Prevailing visibility” is a bit different—the greatest visibility value throughout more than half of the horizon surrounding the observer. This is what gets coded on almost every METAR report. So if visibility is 40 miles to the north, 20 miles to the east, 10 miles to the south, and 5 miles to the west, the prevailing visibility is considered to be 20 miles, since at least half of the horizon exceeds this value.
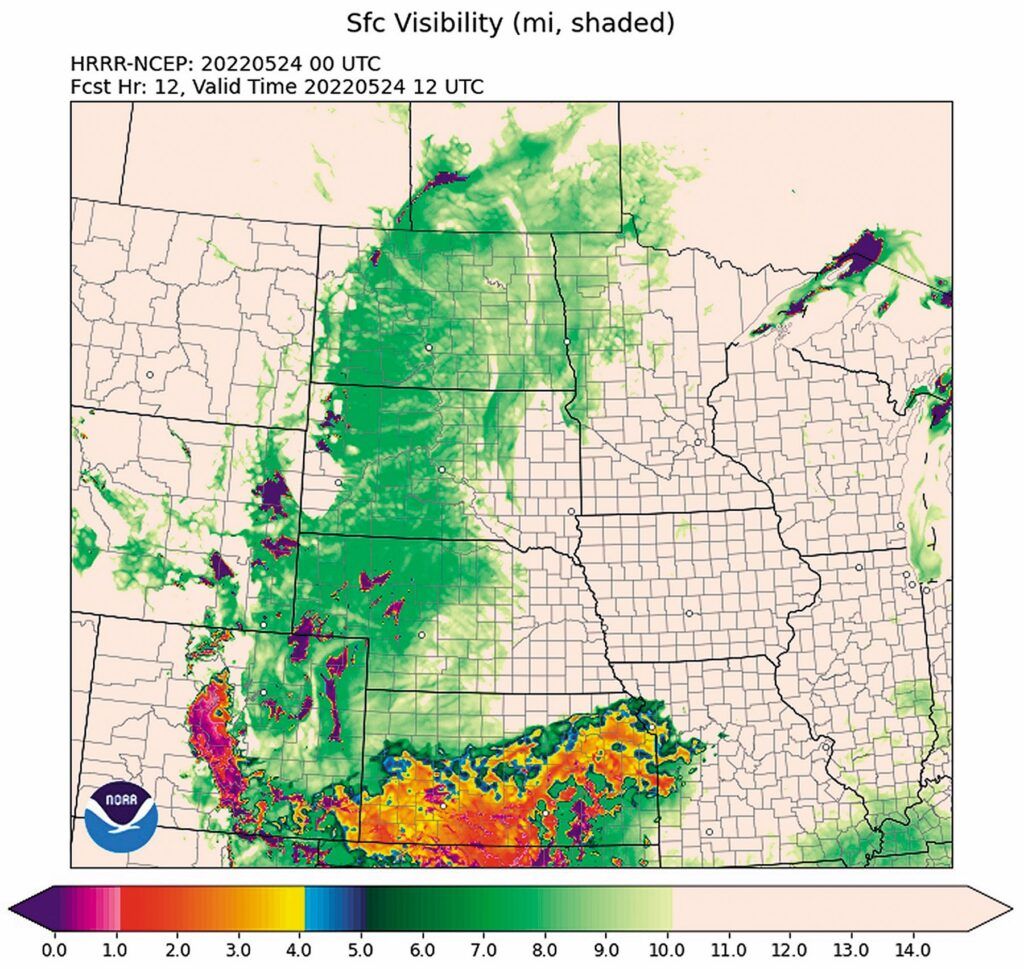
In the United States, thousands of human observers used to go outside at 45 minutes past the hour, every day, and would look all around the horizon to judge visibility and obtain the visibility value. This changed in the 1990s with the new ASOS program. This information now comes from sensors that measure the scattering of light within an air gap only a few feet wide. This is a measurement known as “sensor equivalent visibility,” or SEV.
The technology was extensively researched in the 1970s and 1980s, and it was found that under most conditions SEV can accurately estimate the prevailing visibility. Still, though, it is not an actual prevailing visibility measurement. ASOS cannot see what’s happening around the station. So it’s likely to fail in conditions of patchy fog or when fog layers are unevenly distributed across the airfield.
At ASOS augmented sites, the automated system gets help from actual controllers in the tower. Whenever the tower visibility falls below four miles, the controller estimates prevailing visibility. If it’s lower than that observed by the ASOS sensor, the tower visibility is used in the METAR report and transmitted on the ATIS frequency.
Wind Direction
Wind direction is the direction from which the air originates, and is measured in degrees relative to true north. In spoken ATC communications, such as when talking to the tower, wind direction will be referenced to magnetic north.
When flying into an unusual airfield, check the sectional charts and look at what kind of terrain is upstream. This gives information on what kind of local weather regime you can expect. For example, at Denver, a southwest wind is made up of downslope flow from the Rocky Mountains, and is likely to be dry and in some cases bumpy. A northeast wind, on the other hand, is often associated with cold polar air originating from the northern Great Plains. This air undergoes upslope flow as it rises thousands of feet from these lower elevations, and as a result it tends to be humid and cold, having undergone adiabatic cooling.
Up until the 2000s, wind direction was measured with wind vanes. After numerous instances of these wind vanes freezing up in icestorms, the National Weather Service and Federal Aviation Administration began changing wind equipment to heated ultrasonic units. They can still fail in icestorms, but it’s better than the situation that existed 20 years ago when wind data for large swaths of a state would vanish during winter precipitation.
Wind Speed
Wind speed, of course, is the velocity at which air moves relative to a given point. Most of the time this is the measured relative to the Earth’s surface. During severe weather, forecasters often need to compute wind variables relative to forecast storm activity, giving us “storm-relative” quantities. You won’t need to worry about that, though.
Most forecasters and many pilots prefer that our wind speeds be in knots. (1.15 times knots is mph.) Forecasters occasionally use speeds in mph when referencing damaging wind gusts, as this sort of information is for the use of the general public, insurance adjusters, and news reporters. In Russia and China, as well as in meteorology journals, you’ll encounter wind speeds in meters per second.
As with wind direction, wind speed used to be measured mechanically. The weather agencies were forced to migrate much of the wind equipment to ultrasonic sensors.
Finally of course, wind speed gusts indicate the maximum observed wind speed. In the United States, gusts, by definition, occur whenever the wind speed variation between peaks and lulls is 10 knots or more. This is actually very useful for identifying three key conditions: air masses that are unstable, cold air masses undergoing modification from strong thermal heating, or the presence of convective precipitation—showers or thunderstorms.
Pressure
Atmospheric pressure is simply the weight of a column of air above a given location, per unit area. It can be given in pounds per square inch (14.7 psi), millibars (1013.2 mb), hectopascals (1013.2 hPa), or inches of mercury (29.92 in Hg).
If the Earth were perfectly flat and land mass elevations varied by only a few feet in elevation, pressure measurement would be straightforward. But since stations differ by many thousands of feet in elevation and we need to use a common reference level, it throws a wrench into the work. If you’re in Denver, there’s no way to know accurately what the pressure would be if you were at sea level. This is the pressure reduction problem.
The simplest way to reduce the pressure is to simply use the ISA standard atmosphere, which uses a fixed lapse rate. This technique is used for altimeter setting, also known as QNH. Since it can be measured directly by an aircraft altimeter when parked at field elevation, this is the value that’s preferred in aviation. The local television weather report almost always uses this value when reporting the pressure.
A more complicated method is to run it through equations that use the average temperature over the past day and consider the station’s climatological history. This accounts for nonstandard temperatures and provides a more accurate estimate known as sea-level pressure, or QFF. This is used only on synoptic analysis charts and forecast model fields, and is always given in mb or hPa. It’s also encoded in METAR remarks after “SLP.” At stations close to sea level and on ships, sea-level pressure will be the same as altimeter setting, just in different units.
Sky Condition
The science of reporting sky condition has traditionally been the most abstract and subjective part of weather observation. In the old days before ASOS, observers spent weeks being trained on working with these quantities, especially with ceiling height being so critical. All weather stations had a thick, expensive coffee table book called the International Cloud Atlas for helping to identify clouds. Interestingly you can now download these books for free at cloudatlas.wmo.int including all the old volumes going back to 1956. Isn’t the Internet great?
ASOS has taken over most of these observations, though it gets some help at augmented airports. At most airfields, though, you’re only getting a spot observation from a laser ceilometer that’s continuously pointed at the zenith and used to estimate the conditions at the airfield. This means at medium and smaller airfields, there’s probably some degree of error in the report unless the cloud ceiling is directly over the airfield and is homogenous and uniform.
If you fly outside the United States to the Caribbean and Latin America, or in most of the developing world, chances are very good your observation still comes from a human observer. This is great because a human can see a lot more things than a fixed laser ceilometer can. The downside is that humans, being humans, can be unreliable, especially if it’s not a job that pays well.
All cloud heights we work with are above ground level (AGL). This is a very important distinction, especially if you fly up in the mountains where the AGL and MSL values really diverge. The exception is area forecasts, which reference mean sea level (MSL) since they have to cover a wide area. PIREPs reference whatever level is given by the pilot, which is typically MSL.
Tim Vasquez was an Air Force forecaster who moved away from the forecast counter and into writing books and software. You can catch his frequent weather specials on YouTube—search for Forecast Lab.