Tim Vasquez
The end of summer is near, which means a gradual decrease in thunderstorm activity in the northern hemisphere. But with the return of autumn, we will regularly see the jet stream over the United States. This means more opportunities for precipitation to organize into severe storms. It’s a good time to get up close with radar again and pick up on some things you might have missed in previous training.
The fundamentals of radar were worked out in the 1920s by the U.S. Naval Research Laboratory. Radar technology was developed extensively during WWII, and the first national air traffic control radar network in the U.S. was deployed a decade later following the 1956 collision of two airliners over the Grand Canyon. There was parallel development of weather radar, and the first networks were fielded late in the 1940s to warn of approaching hurricanes and storms. This technology was miniaturized during WWII and became standard in advanced cockpits in the 1950s.
Radar may be old technology, but it’s not obsolete. In fact, radar technology has become increasingly sophisticated, with recent innovations like polarization, which forecasters are learning how to exploit. A surprising amount of radar information can be funneled into the cockpit compared to just 10 years ago. You won’t have to worry about the more complex concepts, but you can use weather radar information to your advantage if you know the basics and what to look for.
Tim Vasquez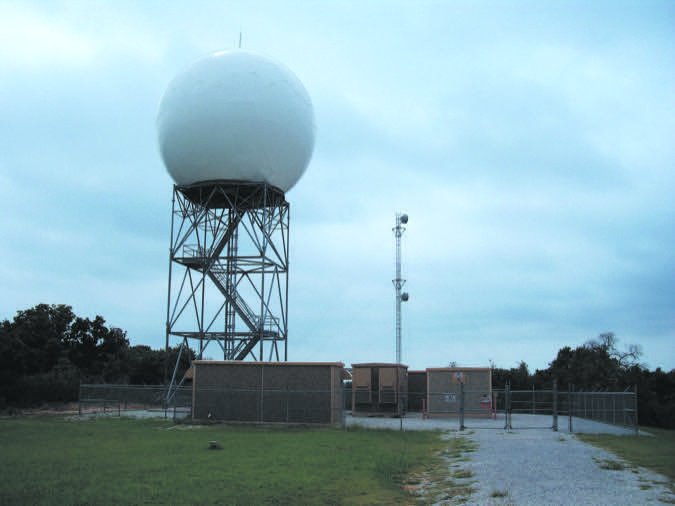
Radar Basics
Radar, an acronym for radio detection and ranging, is the process of pointing a narrowly focused radio antenna at a known azimuth and tilt (“elevation” whenever we are talking about radar), transmitting a radio energy pulse, and measuring how long it takes for reflected energy from a target to come back. Since radio energy propagates at the known speed of light, it’s easy to convert the elapsed time to distance, also known as range. With azimuth, tilt, and range, we have everything we need to determine the X-Y-Z location of a target.
The radio pulse depends on hail, rain, and snow to reflect energy back to the radar, a process called backscattering. Some energy interacts with the electrons in the particle and is lost due to absorption and heat. The remainder of the radar energy is scattered. Only a very small amount of energy makes it back to the radar dish, so radars must be very sensitive.
Radio energy is made up of electromagnetic waves, similar in concept to waves on the ocean. As a pilot, you know that radio waves have a frequency. When you press your “talk” button, the electromagnetic field from your antenna will be oscillating at the selected frequency.
Wavelength is Everything
Since radio energy moves through space at a fixed velocity, it’s easy to convert the frequency to wavelength. Wavelength is the distance between the radio waves—like ocean waves—from peak-to-peak or trough-to-trough. If the waves are moving toward the shore at 10 mph and arriving onshore every 20 seconds, we can calculate that the wave peaks are spaced 293 feet apart. Frequency is inversely related to wavelength, so short (small) wavelengths mean high frequencies, and long (large) wavelengths mean low frequencies.
This is important because radars operate in different bands or narrow ranges of frequencies, depending on their purpose. Nearly all radars operate at microwave frequencies. The common X-band radar operates around 10,000 MHz (10 GHz) and is used for precision approach radar and your everyday airborne weather radar. To get the wavelength, divide the speed of light (approximately 3 108 meters per second) by the radar’s frequency. X-band’s wavelength, then, is 0.03 meters, or 3 centimeters.
This wavelength closely matches the size of large precipitation particles like hailstones. So, X-band radars are sensitive to large raindrops and hail. Unfortunately, decreasing wavelengths are easily attenuated or “blocked,” yielding less penetration into precipitation. Airborne radar can accurately paint a red core in front of you, but the next core beyond that might show as green or yellow due to attenuation, when in fact it should be red. Another problem is that a lot of radar energy is forward-scattered (Mie scattering) at these short wavelengths, so even less energy returns to your dish.
The next longer wavelengths are C-band (6,000 MHz, 5 cm), which were historically used for “storm warning radars” and are now used by TDWR (Terminal Doppler Weather Radar) and TV station radars. They combine the lower cost of short-wavelength radars with the penetration capabilities of long-wavelength radars, but attenuation and forward scattering are still problems. The equipment is also large and doesn’t fit in an airplane.
Finally we have S-band radars, operating at 3000 MHz, or 10 cm. This band is also used by your microwave oven. S-band radars are excellent for weather detection but require a lot of power and expensive equipment. This band is used by U.S. government’s NEXRAD (Next Generation Radar) network, made up of WSR-88D radars. These radars output almost a megawatt and are minimally affected by attenuation.
At the bottom are L-band radars, which have a 23 cm wavelength (1300 MHz). This band works well for large metal targets, and is used for today’s air surveillance. At much longer wavelengths (lower frequencies) we find the WWII surveillance radars, like Chain Home (50 meters) and Knickebein (10 meters). These huge wavelengths are vastly larger than precipitation particles, so they are poor at precipitation detection.
NEXRAD? TDWR?
Sometimes pilots hear “WSR-88D” and “NEXRAD” tossed around. For these we’ll need a bit more background. NEXRAD and WSR-88D are indeed somewhat interchangeable, but NEXRAD refers to the program, the national network, and the technology, while WSR-88D is the model number for the radar equipment itself (Weather Surveillance Radar, 1988, Doppler). They are operated from a nearby weather service office or Air Force base.
NEXRAD began in 1971 with the first research Doppler radar in Oklahoma. This triggered major successful research into the technology, resulting in the NEXRAD system being defined in 1979, as part of an unprecedented joint program between the FAA, Air Force, and National Weather Service. The radar was engineered by Unisys and Raytheon, with the first prototype radar installed at Norman, Oklahoma in 1990 and the first production radar put into service in Sterling, Virginia in 1992. About 160 radars were installed and each site cost about $2.5 million.
As mentioned, NEXRAD uses S-band radar with a massive dish measuring 28 feet in diameter, giving it exceptional listening ability. The longer wavelengths cannot detect small cloud droplets, but NEXRAD’s large dish size and sensitive electronics allow it to pick up drizzle and snow. The larger radars also produce a tighter 0.925-degree beam width, while airborne radar beam widths are on the order of about 8 to 15 degrees.
And now we have the TDWR (Terminal Doppler Weather Radar), which is functionally like a miniature NEXRAD. The difference is TDWR is shorter wavelength and lower power. This data is not normally available on the web but can be viewed on apps like RadarScope and in specialized flight apps. TDWR was developed in the 1990s by MIT and fielded in the 2000s to give controllers fast, detailed images of storm structure and wind fields at large airports. There are currently 45 TDWR units around the country and in Puerto Rico.
Controllers can also get a surprising amount of detailed weather information not only from NEXRAD and TDWR but also from the Weather Systems Processor attached to many ATC radars. So ask ATC about the weather; they can see a lot more than you might suspect.
Pros and Cons
We’ve seen the huge impact that wavelength has on radar performance. To detect the details of a cumulonimbus cloud, we need ultra-short wavelength K-band radar, but these are extremely susceptible to attenuation and would pick up all clouds, creating a mess of distracting information on the radar. So always bear in mind that some parts of the storm, especially intense, dangerous updrafts, will be invisible on radar.
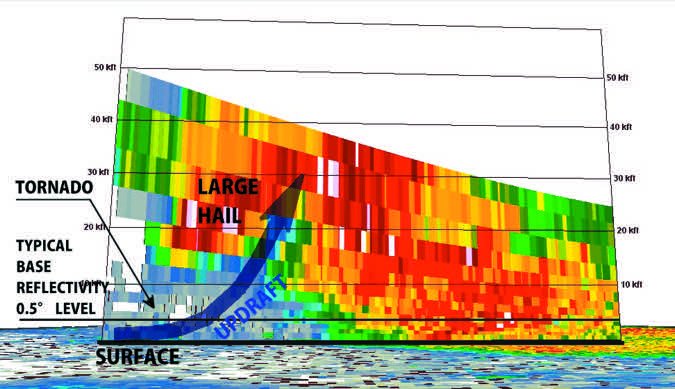
With conventional WSR-88D ground radar, as you might receive from XM Weather, the radars are always tilted slightly upward. This tilt can range from 0.5 to 19.5 degrees vertically. Without some tilt, radar would see lots of ground clutter, reducing the strength of the beam. A half-degree tilt combined with the earth’s curvature effectively limits range to 200 miles.
The upward tilt also means that the beam height increases with altitude, and the radar has the tendency to overshoot distant targets. At a range of 50 NM, the beam is 5000 feet above the ground, and at 100 NM it’s 12,000 feet high. This is one reason extreme caution is needed using surface radar to make tactical decisions around an airfield, such as trying to avoid an intense core near the approach path. In some strong storms such as supercells, the radar can even undercut dangerous parts of the storm .
Radars are prone to refraction problems. This happens when there are strong density contrasts with height. This is most common in warm-over-cold situations (extremely stable air masses), which tends to bend the beam downward where it might reach the ground or “duct” through the stable layer, producing massive regions of false targets. This superrefraction looks like a precipitation area that remains almost perfectly motionless. It’s very common on cool nights during the spring and fall, especially after precipitation has moved through the area.
In extremely unstable air masses (cold over warm), the beam might bend higher than usual. This can cause slight overshooting of nearby targets and total overshooting of distant targets. This subrefraction, isn’t as big a problem.
When there are strong targets hundreds of miles away, radar pulses can clip the tops of these storms, and return to the radar after the next pulse is transmitted, This causes the radar to erroneously place these targets closer to the radar. The WSR-88D is very good at removing these artifacts, though they can corrupt the velocity data. Other radars, including airborne radars, can display these false range-folded artifacts.
The Products
Radar reflectivity is the product most widely used in aviation and forecasting, and it expresses the power returned from a given sample volume in decibels. Keep in mind that there are two different ways of displaying reflectivity data: base reflectivity and composite reflectivity. Both are in widespread use. A significant problem is that these types are not identified in product legends or product manuals, users are often unaware which one they are using, and as a result, users have no understanding of the pros and cons of each type. However they can show major differences.
Base reflectivity is simply the observed radar picture at one specific tilt. For ground radars, this is usually a half degree up but can be at any angle up to 19.5 degrees (NEXRAD) or 60 degrees (TDWR). Airborne radars and ADS-B are sources that display base reflectivity products.
Composite reflectivity takes all available tilts and stacks them, displaying the highest reflectivity at any level for each pixel. This is a valuable product because it shows the full areal coverage of the storm, and can help spot suspended hail and heavy precipitation that doesn’t show on lower tilts.
Finally, we’ll repeat that you must be aware of the delays if you are using XM Weather, ADS-B, or Internet products. The storm might have moved while you wait for new data. Animating the frames can help to some extent, but important changes can occur quickly. Microbursts, for example, have a life cycle of mere minutes and can be already hitting the ground while old radar data shows weak echoes.
Radar can be an amazingly valuable tool if used correctly. But make sure you’re aware of all the limitations. You should now have a solid understanding of the technology. Quite often what you get is not what is pictured on the radar, and there are good reasons. Always check product times, if available, and know your data and its source. Most of all, use radar to keep you safe.
Meteorologist Tim Vasquez used to brief B-1B crews in the morning. Now he sleeps in and writes books and software. See www.weathergraphics.com.