
Fronts in TAFs and weather briefings often mean a day of delays and canceled plans. Considering the impact that they have on flight operations, we should understand fronts. Let’s study them so you can make a good guess about the resulting weather.
Our modern knowledge of fronts began around 1910 in the Bergen School of Meteorology in Norway. Their early work laid out the mathematics of forecasting and described fronts, showing that they are defined by a change in air mass density. Changes in wind speed, humidity, or pressure are all secondary.
The Key: Air Mass Density
Air mass density is the mass of the air per unit volume. The mass of the lower atmosphere is typically about one kilogram per cubic meter. Ground school or just putting in flight time has probably made it abundantly clear that cold air is denser. The low density of warm air on the other hand is what makes hot and high operations so problematic.
How about moisture? You might think moist air is denser, but water is made up of oxygen and super-light hydrogen, while the air itself is made of nitrogen, oxygen, carbon, and other heavier elements. So a dry air mass has a little more density than a moist one.
From Different Worlds
An air mass is kind of a subjective term that describes a body of air that’s all coming from roughly the same location and has a lot of common characteristics. For example, as I write this, a front is moving southward through Dallas. A model diagnostic I ran shows that the air in Oklahoma City was in British Columbia four days ago, while Houston’s air was drifting aimlessly across Alabama. Each of these air masses has different temperature and moisture profiles.
As a pilot, you probably don’t care much about the origin of the air. It’s the weather associated with the front that means everything: clouds, icing, turbulence, and winds. The jet stream winds that we find on a given day are caused almost entirely by the fronts below and the strength of their density gradients. The clouds and precipitation are caused by the response of the air masses to the frontal activity and the jet stream itself. Everything is interconnected.
Life and Times of a Front
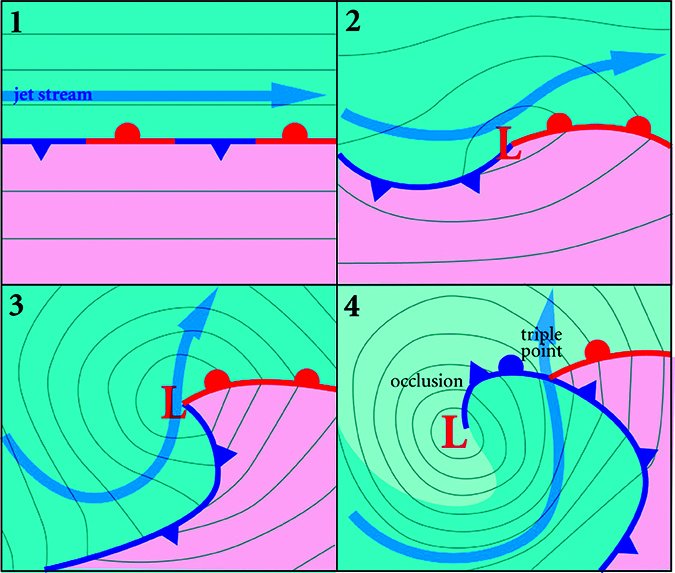
Let’s take a look at a front as shown above. The first is a stationary front because, well, it’s not moving. It’s dividing two air masses—one cold, the other warm (1). When an upper-level disturbance approaches the front and removes mass from the column of air, such as upper-level divergence, this causes pressures to fall at the surface. A weak low pressure area, called a cyclone, develops (2). The surrounding air from both the warm and cold air masses tries to move inward to fill the void. This strengthens the density contrasts along the front.
This causes a significant response in the upper levels of the atmosphere (3), because air mass contrasts are magnified aloft. Think of cold air as the Wednesday newspaper, while the warm air is represented by the thicker Sunday newspaper (thicker because the air has less density and “expands” slightly in volume). While each newspaper is less than an inch thick, in stacks of 100 newspapers, Sunday papers tower over Wednesday.
This kind of difference in the atmosphere produces strong pressure gradients aloft. Lots of deep cold air on one side of the front means strong pressure contrasts aloft. Likewise, unusually cold temperature on one side of the front has the same effect. And tightening the contrast between warm and cold air intensifies the pressure gradient too. All of this is what causes the jet stream, and it’s why jet winds are stronger in winter.
So with warm and cold air coming together with our developing system, the upper-level winds strengthen. And when this happens, the upper-level disturbances intensify and can produce stronger forces. We have ourselves a chain reaction.
Eventually we have a well-developed frontal system with the cold front moving southward (in the northern hemisphere; if you’re in the southern hemisphere, sorry, just flip north and south). This cold front moves far into the warm air, while the warm front is likewise moving northward. At this point we consider the system to be mature.
The Occlusion
It’s easier for the cold front to move rapidly. It’s like cold air pouring out of your refrigerator: it’s cold and very dense, and rushes along the ground like a tsunami. But the warm air is buoyant and is flooding in to replace cold dense air clinging to the ground. So the warm front naturally has a slower movement. The cold front eventually catches up to the warm front, usually in just a couple of days with a typical frontal system.
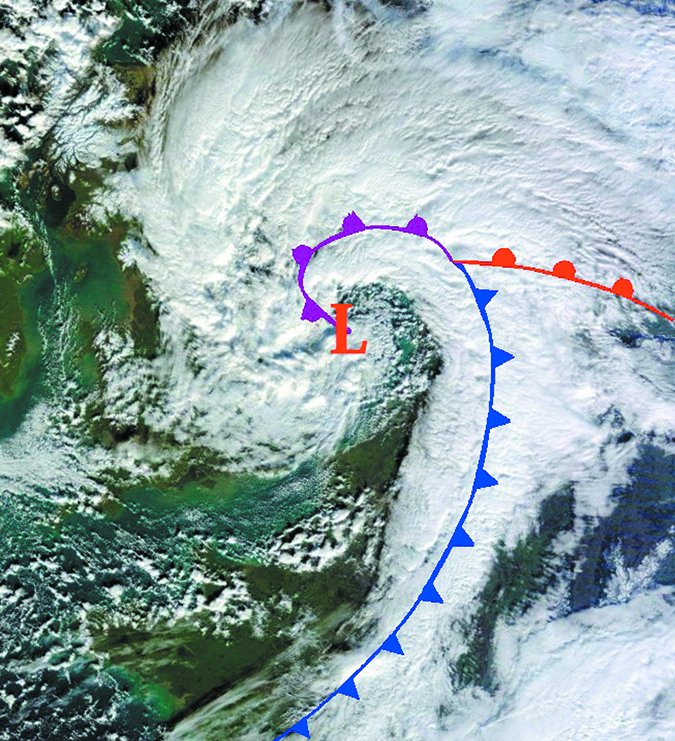
Where the fronts collide, the warm air mass is pushed aloft, and the front left on the ground is referred to as an occluded front (4). It’s important to note that this occlusion moves down the line like a zipper. The original cyclone finds itself cut off from the temperature contrasts, and we refer to it as an occlusion, one that is becoming increasingly barotropic, or without temperature contrasts. It may still persist for many days, but it is slowly dying and pressures in it are rising.
Meanwhile, the area near the “zipper”—where the occluded front, warm front, and cold front meet— is known as the “triple point”. This is a ripe area for development of a new low, and we refer to this area as baroclinic. If a low pressure area forms here, it goes through the same cycle of development and occlusion, and it all begins again.
Front Structure
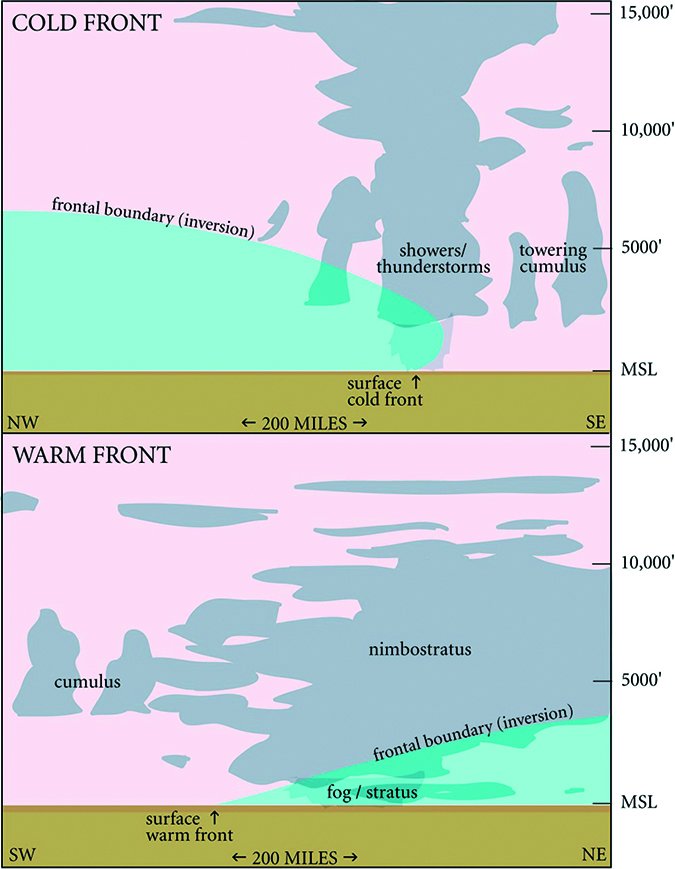
Fronts aren’t vertical “walls” where cold and warm air meet, but the boundary has slope. This slope is always upward into the cold air. This is true of cold, warm, and stationary fronts alike. The slope of a cold front is about 1:75—the frontal boundary at 5000 feet (1 mile) is found about 75 miles to the north or west of the surface front. A warm front has a slope of about 1:175, so we would instead find the 5000-foot front 175 miles from the surface front.
One of the most important parts of the front is the jet stream. Since the front slopes upwards and to the north, the area directly above this zone is where we find the strong pressure gradients in the upper atmosphere. So the jet will almost always be just north of the fronts, oriented parallel to them. This is one rule of thumb you can use when you’re looking at charts. The jet stream will be fairly close to the cold front, but further from the warm front due to the weaker slope.
The Weather
You might wonder why weather is often bad around fronts, and how we can use this to our advantage. Keep in mind that nearly all clouds, precipitation, storms, turbulence, and icing are associated with areas of (ascent) rising air. Nearly saturated air is the key. As we mentioned, frontal systems mean intense upper-level circulations, and this can produce strong areas of ascent. Large areas of forced lift also destabilize the atmosphere due to the release of potential instability. All of this is why you should always plan on IMC around fronts and have a generous amount of reserve fuel.
More importantly, natural air movement in the atmosphere isn’t horizontal. It moves slowly up or down as it travels to conserve potential temperature; in other words, it clings to its “potential temperature surface” or isentropic surface (assuming heat isn’t being added or removed). This is an advanced concept, but picture isentropic surfaces as layers of blankets on a bed. If a mass of cold air is on the bed, the blankets are displaced upward over the cold air.
What if we have a warm front—where the blob of cold air is gradually leaving the north side of the bed? Ants, representing air, are trapped in the sheets and move aggressively from the warm south side of the bed to the cold north side. If you’re in your airplane flying through these blankets (your airplane can magically pass between them), you see the strong southerly flow as the ants ascend—this ascent produces clouds and precipitation. This is often called “overrunning.”
Most of the clouds here tend to be stratiform—stratocumulus, altostratus, and cirrostratus. Sometimes embedded showers and storms will develop, while cold fronts and cumuliform clouds predominate, with showery precipitation.
Now take a cold front, advancing across the bed from west to east like a wedge. Maybe the mid-level flow is weak, with lethargic ants, or maybe they are moving more north toward the low pressure than eastward. In both cases, the blankets rise and the ants rise with them. We see clouds and showers produced up to 100-200 miles behind the front. We call this an anafront or “active front.” This is common with systems in the western United States.
But some cold fronts, not only move rapidly west-to-east, but there is strong west-to-east flow aloft; perhaps a very strong jet stream. The ants are moving east with the strong upper-level winds, and they tumble down the blankets as they go. This produces sinking motion and fair weather, and the result is a katafront, “inactive front,” or “dry front.” These systems are often seen in the central United States, and most of the weather will be ahead of them. They tend to have sharp changes in wind direction and wind speed as the front passes.
Overall, keep in mind that rising air always means clouds and possible rain if the humidity is high enough. So the first thing forecasters look for is ascent.
The Dryline
In aviation, we don’t talk too much about the dryline, but they’re very common on the Great Plains and with strong frontal systems, may sweep as far east as the Mississippi River. They’re shown on some weather maps using a brown warm front symbol with hollow pips, while other maps may show them as troughs. The dryline separates dry air originating from the higher elevations of New Mexico, Arizona, and northern Mexico from moist tropical air from the Gulf of Mexico. The dryline has an unusual slope, often sloping upward and then eastward with height, allowing warm dry air to overlie the tropical air and producing the “cap” that often keeps severe storms bottled up like a powder keg.
Drylines will not give you trouble and in fact the dry air mass is normally cloud free with excellent visibility, including the part overlying the tropical air mass. Just watch for thunderstorm activity along the dryline itself, and be aware that strong jet stream winds within the dry air mass may raise loose, dry topsoil in places like West Texas and the Oklahoma Panhandle every few years, dropping visibilities to zero in places like Amarillo and Lubbock. Altitude is your friend; if you can get up above 10 to 15,000 feet you have a good chance of getting on top of it.
Putting it All Together
Say you’re flying along over Ohio, heading westbound. It’s been a long day, and your memory of what you saw on the weather charts is a bit hazy. It’s April, you’re at 10,000 feet, and the weather is becoming progressively cloudier. Soon you’re in thick overcast, and a steady rain is hitting the windshield. You can see that you’re catching a strong crosswind from the left side. What does this mean? Let’s visualize what’s going on.
The crosswind tells you that there is strong warm advection going on, and you’re probably above the warm front transition zone. The steady nature of the rain suggests that these are stratiform clouds. The warm front at the ground is to your south, and you’re in the area of ascent over the warm front zone. As is common with warm front situations, the terminals below you probably have IFR conditions with extensive fog and stratus.
Perhaps you have to change course. If you fly to the north, there’s a good chance the wedge of warm air you’re in will thin out as the cold air mass rises to meet you. This could bring you into areas of icing. Flying to the south will take you into an increasingly deep warm air mass, and you’ll probably find more showery activity and maybe even storms that way.
We can’t be sure what’s ahead of us without the charts. But if the weather improves and we maintain the south wind, we’ve probably broken into the warm sector and with good flying until we cross the cold front, still ahead. If we see a shift to northerly wind or a headwind at cruise, this is a good sign we’ve crossed over to the back of the system, and we’ll start seeing improvement. Terminals below us are probably becoming VFR.
That’s a good example of how we visualize the weather systems. In fact pictures like that are always in my mind when traveling, even when I’m looking out the window flying commercial. All you need is to have the basics down firmly, and build a consistent mental picture of what’s going on. Oh, and keep reading Wx Smarts every month to learn more bits and pieces that you can put together when you’re up in the air.
Tim Vasquez is a professional meteorologist in Palestine, Texas. See his web page and his various materials at www.weathergraphics.com.


