
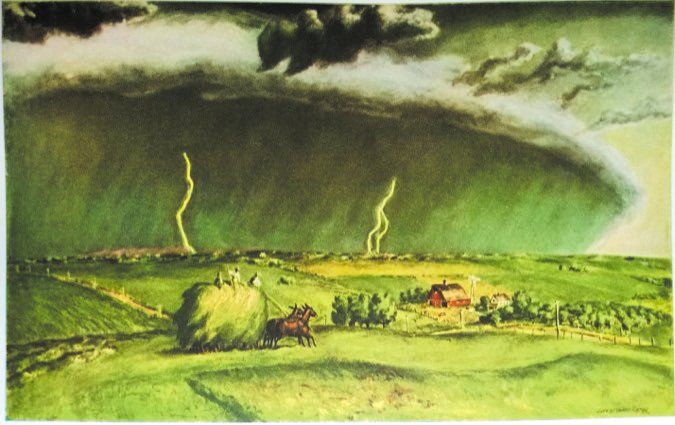
February and March bring the peak season of the squall line. They are perhaps the most formidable of all the mid-latitude weather systems. Most of us at one time or another have witnessed the alarming black mass spanning almost the entire western horizon, followed by the fury of raw wind, small hail, and torrential rains. Indeed these storms were recognized by early Scandinavian fishermen and traders for the sheer amount of rain they produced. In the 17th century the Norwegians gave us the wordskval, meaning “a sudden rush of water,” anglicized to squall by the sailors of Britain.
Early in the 19th century, a barometer was on every ship and hung in many offices. Squall lines were always suspected whenever the barometer was falling rapidly and the air was sultry. Early meteorologists recognized that it was a clash of air masses that fueled the storm, but the storms were thought to result from chaotic motions indescribable by modern physics. However it was the French meteorologist E. Durand-Greville who pored through weather reports in 1892 and quantified the dimensions. Looking at an August 1890 system that steamrolled through France and Germany, he found the system spanned an impressive 500 miles, showing these were much more than just local storms.
Turning to Technology
Squall lines during the turn of the century were studied in terms of their barometric characteristics, but by the 1920s they were linked to the Norwegian cyclone model, which provided one of the first modern, consistent, and three-dimensional pictures of weather systems. Still, the understanding of what was in squall lines was elusive. In the 1930s and 1940s, many forecasters were convinced that tornadoes came entirely from squall lines, a myth that took a few decades to dispel but continued to appear in pilot training materials four decades later.
The multi-agency Thunderstorm Project of the 1940s and the development of radar were what modernized our look at these storms and gave us a look at the internal workings. Some of the next major developments came in the 1980s with widespread Doppler radar studies and computer modeling, which completed our understanding of where the squall line comes from and how it develops.
In the past 20 years, meteorologists have chosen to refer to squall lines as mesoscale convective systems (MCSs). You will still see this in forecast discussions and convective outlooks. The reason is that severe weather development usually involves the loss of 2-D structure and the appearance of changes and structures in the third dimension (the linear axis). The phrase “squall line” doesn’t properly account for this. However we may still use the term “squall line” as it remains a common term for these kinds of storms. If you talk to a forecaster, they’ll know what you mean.
Squall Line Defined
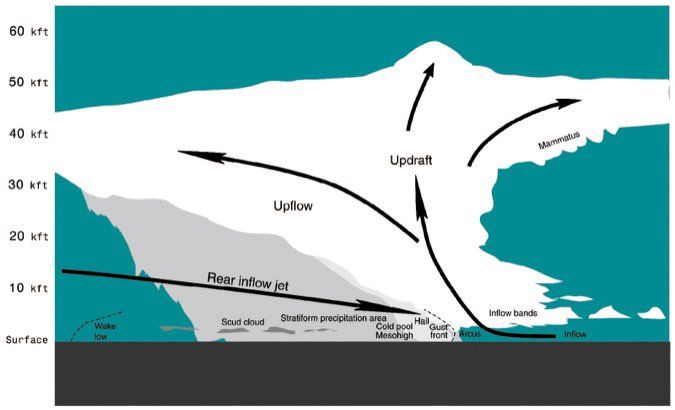
Simply put, a squall line is a solid or near-solid line of thunderstorms. In fact, a true squall line is often handled as a two-dimensional system in computer modeling. The Thunderstorm Project showed us that all thunderstorms are made up of a pair of cells: an updraft and a downdraft. The updraft is a rising air current comprised of cumulus and cumulonimbus clouds that originate from quasi-horizontal warm, humid inflow to a storm. The downdraft is a sinking air current, comprised mostly of rain, hail, snow and ice (at higher altitudes), and gusty winds. It produces a quasi-horizontal outflow with a cool, dry character.
The outflow is important because development and maintenance of the squall line is centered on the leading edge of this outflow. We call this leading edge the “gust front.” As you might suspect, it acts very much like a small scale cold front. On the east or south side of the gust front we find inflow feeding the squall line, while on the west or north side, we find outflow spreading out from the squall line.
Visually, the gust front is usually marked with a low updraft base. It may be accompanied by arcus clouds. These are ominous looking, linear clouds close to the gust front. They don’t mean anything by themselves, though they do mark an axis of severe turbulence. If rapid, consistent motion of cloud fragments is seen, especially if it is circular, expect tornado warnings to follow. There will be no doubt when you see tornadic rotation.
Tornadoes and Squall Lines?
Squall lines by themselves are not tornado producers. To produce a classic tornado, we need a mesocyclone, a deep and consistent rotating cyclone embedded within the storm, from which a tornado might spawn. A mesocyclone measures about two to six miles in diameter and the rotation is concentrated mostly between 10,000 to 20,000 feet. As a general rule, this does not develop in a squall line unless a break forms in the main line and strengthens, or this segment moves ahead of the line, or if an isolated storm forms ahead of the line.
However, weak tornadoes often do form. The quasi-linear convective-system tornado describes most squall line tornadoes. They are not well understood and in many cases due to their short scales of time and spatial dimension, only a trained forecaster can find them in WSR-88D radar data. They are common during the nighttime hours. There are some preferred locations for their development, for example, just north of the apex along the leading edge, but they can appear in unexpected areas. They can produce EF2 damage, so they shouldn’t be taken lightly.
One final type of squall line vortex is a gustnado. These are very shallow circulations that occur entirely within a few hundred feet of the surface. They are caused when vertical vorticity fields along the gust front wrap up and stretch quickly. These last no more than a minute, only briefly appear on radar, and they cannot be forecast. However they can peel roofs off, tear up hangars, and toss parked airplanes. Since they are common, they present tremendous danger if you’re landing with a storm nearby and a gust front is on the airfield or on the localizer.
The Derecho
A particularly severe type of squall line is known as the derecho. These were identified as far back as the 1880s by Iowan climatologist Gustavus Hinrichs, a man far ahead of his time. He set up a volunteer observation network and examined the behavior of storms that passed through, at a time when radar was just a pipe dream. Hinrichs found that some squall lines created long corridors of damage as they moved west to east, and that they had no tornadic character, but perhaps could be likened to a horizontal tornado whose axis is parallel to the ground. He called these peculiar types of storms derechos, Spanish for “straight ahead”, in an 1888 paper.
Unfortunately, Hinrichs’ studies were neglected for decades. The newly minted U. S. Weather Bureau, spun off from the U. S. Army Signal Corps, decided to take a “head in the sand” approach to severe weather, and storm meteorology ground to a halt until the 1940s. Joseph Galway of the National Severe Storms Forecast Center (now Storm Prediction Center, SPC) revived the term derecho in a 1987 paper. With the coming deployment of WSR-88D Doppler radars and the thirst for storm forecasting techniques, the meteorological community embraced the term for good.
The derecho continues to be extensively studied, and can be defined as a damaging windstorm co-located with a squall line. The forecasters at SPC officially define the derecho as a storm that creates a swath of wind 250 miles long with gusts to 50 knots or more. Even if this requirement is not met, a squall line can still produce extensive damage. For example, the structure in one part of a squall line may organize into a supercell and produce a tornado.
Bow Echoes
Small-scale severe weather is often produced by “bow echoes,” cells that appear as a sideways “U” shape, the curve of the “U” pointing downwind. This is not a specific type of storm, but is the end result of a gust front that has bowed sharply outward, producing damage and resulting in the distorted radar echo shape. Also storms may develop rear inflow jets, where dynamics within the squall line couple and duct high-speed mid-level wind down to the ground. This too produces the U shapes, except that the inner portion of the curve (on the west side) is very sharply defined and tends to show weak radar echoes within the concavity.
Both of these are tricks you can use to spot dangerous storms on radar. This does not work as well with airborne radar as the higher wavelengths don’t have the ability to penetrate the entire cell, and even if they do, the reflectivity patterns may be distorted. However the technique does work with the WSR-88D, whose half-megawatt S-band power pushes through the strongest of storms.
The takeaway is not to focus on only one cell—if you see bow echo shapes on one cell, high winds are possible with all of the cells. The most isolated cells and the ones furthest ahead of the line are favored. But if no bow echo shapes are seen and there are no weather warnings in effect, high winds are unlikely in all of the cells.
Staying Safe
It’s important to keep in mind that computer models have very limited ability to properly forecast squall line progression. Even the best available model, the HRRR (High Resolution Rapid Refresh) reaches its limits. There are too many factors to deal with, such as cloud physics modeling, latent heat, and boundary interactions. Furthermore, to work correctly, a model has to accurately represent the atmosphere, down to the smallest details.
Ideally every cubic centimeter would be accounted for, and its heat, humidity, and motion would be known. Even a pilot walking out onto the ramp at Teterboro, pushing the air aside and setting off small eddies, would have to be modeled. Of course none of this is realistically possible and the technology to sample every cubic centimeter does not exist.
So we feed the models approximations. We use METAR observations, giving us data every 10 or 20 miles, as well as radiosonde data, ACARS/AIRMET data from thousands of airline flights every day, and even radar data. This in itself is a massive undertaking and there are teams at NOAA and at universities whose jobs focus solely on assimilation of data. The many types of data at different times and locations have to be organized, quality checked, and properly initialized for use in the model run. The idea is to accurately assume what is happening where we have no data before we even run the model.
The assimilation process was developed in the late 1950s and has improved tremendously since then. But up until the mid-1990s, the everyday models that were in use did not even have the ability to properly represent thunderstorms, or even larger systems like squall lines. It took a new generation of models called mesoscale models, which had all of the equations to handle processes at the small scales we see in thunderstorms. Some examples of early mesoscale models are the MM5 and the RUC. Many of these technologies were refined and developed into the WRF (Weather Research & Forecasting) model that was officially released in 2004 and has revolutionized forecasting.
Putting it Together
On the Internet you can find websites with WRF data at the smallest scales. These are NOAA’s RUC and HRRR runs. These provide the best glimpse at predictions of thunderstorms. But try following one of these models on a storm day. They tend to usually get the general details correct, but the closer you look, the more errors you find. And the errors grow rapidly over time; for a squall line, five to 10 hours is about the limit. The technology is simply not there to correctly model these storms.
This is why forecast offices rely on human forecasters. They “fill in the gaps” with conceptual knowledge and experience, and can spot when the models are failing or not verifying correctly. This is one reason why weather briefings with a qualified forecaster are essential. Seeing the maps on the Internet is one thing, but having the complete picture comes down to experience and expertise.
Another way you can easily forecast is by using real data—radar and visual observations. For example, animate the radar data and take note of which way cells are moving and what their speed is. Take note of trends for all the cells. If most of the larger cells are weakening, this is a good sign things are falling apart. All of these techniques can provide plenty of information to project movement and anticipate where the squall line will be in an hour,
Now you know a little bit about this unique storm. You have an explanation if you see it on weather radar, an understanding of the airflow and types of severe weather, and you’ll know what to look for when it becomes severe. Should you decide to go the extra mile and sample the ride, we can only advise FL390, airborne radar, and plenty of mass. Lacking that, look for a Plan B and stay safe.


