
With sunny skies and calm winds, it’s a surprise to reach cruise altitude and find a bumpy ride. Though computer modeling is beginning to overcome many limitations in turbulence prediction, the products aren’t always accurate and don’t convey the nature of the problem. So, it’s pretty important for pilots to be well versed in what causes turbulence. Fortunately we can distill it all to two root causes: buoyancy and friction. These are the building blocks of virtually all turbulence types.
Convective Turbulence
The most familiar source of turbulence is thermals, the result of sunlight striking the ground. This generates vertical air movement, because a cold-over-warm layer is unstable and has a tendency to “overturn”, while a warm-over-cold layer is stable and will return to this state if disturbed. Is the sunlight shining on asphalt? This creates a cold-over-hot layer at pavement level, so the layer spontaneously overturns. Buoyant thermals rise off the ramp and ascend skyward.
These thermals aggregate and rise like bubbles in a boiling cauldron, while air sinks in other areas to compensate for the upward movement. Glider pilots love these rising bubbles, but they add a lot of chop to the lower atmosphere, especially in the summer months. Fortunately they are predictable. Thermals are strongest over solid masses like roads, parking lots, barren fields, and rocky terrain, while they’re weak over forested areas, water bodies, and crop fields. So as you’re descending on final, awareness of whether you’re passing over fresh asphalt or a golf course can help you predict the tuning required for your glide path.
As instability increases, we get updrafts and downdrafts in cumulus and cumulonimbus clouds. The cauliflower-like cloud mass itself should be considered a manifestation of the updraft, with downdrafts occurring around the edges and in precipitation cores. Updrafts and downdrafts are often the end result of thermals working on an unstable atmosphere, but thermal instability, the release of latent heat, and pressure perturbations within the storm are the cause.
A good rule of thumb is to assume all cumulonimbus clouds have dangerous turbulence. But a more meaningful question might be “How dangerous?” A common meteorological value called CAPE, or convective availability of potential energy, yields information on updraft strength, and to a limited extent, downdraft strength. CAPE is essentially a measure of instability through the troposphere. Any cumulonimbus cloud in an air mass with CAPE values over 1000 to 1500 J/kg is likely to contain localized areas of extreme turbulence. Websites like the Storm Prediction Center and university websites like College of DuPage Weather have excellent maps showing CAPE across a region. But check the times—the afternoon CAPE might well be higher than that of the morning hours, and avoid fine-grained interpretations of the chart as the upper air data network worldwide is rather coarse. Even the best numerical models only have a limited ability to resolve small details.
Though good flight planning and onboard radar will help you avoid traveling through storms, they do pose a hazard when they’re near airports. Several devastating mainline air crashes in the 1970s and 1980s were caused during the takeoff and landing phases of flight by nearby thunderstorms. Weather hazard training usually focuses on the microburst, but pilots need to be aware that microbursts are one small part of the picture and all parts of the storm can contain tremendous horizontal or vertical velocities. Near the surface, updrafts produce convergent storm inflow, while downdrafts cause divergent outflow. Encounters with the updraft and downdraft produce sharp vertical speed changes, while the inflow and outflow area cause dramatic changes in airspeed. During the takeoff and landing phases, a pilot may cross over any four of these storm parts in a matter of seconds, causing catastrophic loss of control.
Again, CAPE is perhaps the best tool for indirectly predicting how strong these circulations will be. Some experienced pilots are familiar with the “lifted index,” which has been a staple of NOAA aviation facsimile charts since the 1960s. The lifted index is similar to CAPE but only gives a sense of vertical velocity at one specific level in the atmosphere: roughly at about 18,000 feet. Strong acceleration of an updraft may be occurring at other levels or through a deeper layer, and CAPE does a better job considering this. You can use this information together with SIGMETs and Storm Prediction Center convective outlooks to get an idea of the risk from any storms that do break out.
Mechanical Turbulence
If you’ve been bumped around on a late-night approach, you know the winds are gusty. Mechanical turbulence occurs when strong winds interact with objects on the ground. The friction produces eddies that expand and churn the air near the ground. Normally, mechanical turbulence occurs with winds above 15 knots, and has a typical depth of up to just a couple hundred feet above the ground. But if there are large obstacles like mountains, winds are over 25 knots, or the atmosphere is unstable, this turbulence can be thousands of feet deep as Rocky Mountain pilots well know.
Mechanical turbulence can be carried through a deep layer and strengthened in an unstable air mass, so if there’s strong solar heating, the turbulence will be deeper. But there’s another effect that often comes into play: air mass modification. Fresh cold air masses moving out of Canada and the Great Plains may contrast sharply with the warm ground beneath, dramatically increasing the production of thermals. In the 1950s and 1960s, forecasters used to annotate these air masses as “cPk” and “mPk,” identifying potential zones of low-level turbulence.
Mountain Wave Turbulence
We covered mountain wave turbulence in December, 2012, so here we’ll just cover the basics. Mountain wave turbulence results from the mechanical turbulence of strong winds impinging on a mountain range. It is most commonly seen in winter east of the Rockies, but can also occur along the Appalachians, Cascades, Greenland plateau, and other ranges.
Mountain waves and windstorms result from a strong pressure gradient across a mountain range. One perfect example is low pressure around Denver and high pressure in the Four Corners. Depending on the stability of the air mass, intense “gap winds” can blow through mountain passes, carrying extensive mechanical turbulence miles downstream.
However mountain wave turbulence can also produce large oscillations in the middle and even the upper levels of the troposphere. These are known as gravity waves, and may appear visually in the form of features like roll clouds or rotor clouds. The wavelength might be on the order of several miles. Normally the air aloft is stable, giving the roll clouds and rotor clouds a laminar appearance. The oscillations dampen and smooth out. But in other cases, the oscillations destabilize as they move downwind, eventually breaking, much like a wave crashing onto a beach. Here the airflow is chaotic and there is the potential for extreme and damaging turbulence. Currently it is not possible to predict breaking of gravity waves since it occurs on very small time and space scales, but extensive work is ongoing to identify areas favorable for this activity in turbulence modeling.
Clear Air Turbulence
While the early aviators were well-versed in mechanical and thermal turbulence, World War II brought a new mystery to forecasters. As the German and Japanese empires expanded in the 1940s, the Allied air forces began exploiting the upper troposphere, sending new aircraft designs beyond 25,000 feet to avoid the hazards of low-level air defense. Not only was the jet stream discovered but crews regularly ran into heavy turbulence in relatively clear air. It had no explanation since there were no solid objects at these altitudes to produce mechanical turbulence, and ground-based thermals were found to diffuse by these altitudes. It became known as “free air turbulence” and eventually “clear air turbulence”, or CAT.
The U.S. Air Force and operators like United Air Lines developed excellent empirical methods for forecasting CAT, but it took until the 1960s to better understand the causes. CAT is essentially the result of strong shear around the core of the jet stream. So CAT is typically parallel with and just above and below the upper tropospheric jet stream, and is strongest where the vertical shear is greatest.
There are excellent models for forecasting CAT using the physics of turbulence, but these are limited by the lack of radiosonde data over the oceans. Model data over remote areas comes mostly from continuity from previous model runs and spotty wind data from aircraft and satellites. Pilots flying oceanic routes and remote regions are more likely to encounter unforecast CAT, requiring knowledge of its signs and indicators.
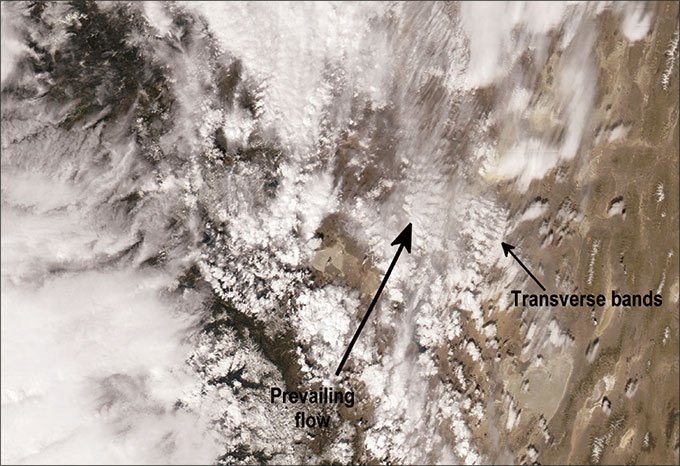
You can see CAT if there are clouds, typically cirrus. They might show transverse bands perpendicular to the upper-level winds. These are visible on satellite images and in flight. They may also show small-scale vertical ripples and waves, not seen by satellites. Visible mountain wave clouds and lenticulars, normally connected with mechanical turbulence, often accompany upper-level CAT.
New research is showing some misunderstandings about CAT. Many of the damage incidents traditionally blamed on shear around the polar jet have more to do with wave breaking episodes in mountain wave turbulence extending hundreds of miles downstream from the mountains that caused them.
Wake Turbulence
No article on turbulence would be complete without at least a mention of wake turbulence. This, of course, is produced by your fellow aviators. Two counter-rotating vortices are shed horizontally from the wingtips of all airplanes, but are strongest in take-off and landing configurations. As a general rule they descend to the ground at a rate of about 500 fpm while moving horizontally with the wind. Thus, you should focus on what’s upwind—that 767 that took off on an upwind parallel runway may have shed a wake vortex that is drifting into your path. If you can, stay above or upwind of it. If you can’t, wait.
Most turbulence we encounter is only unsettling. But, occasionally it can be severe enough to rip small and even large bits off our aircraft. A little understanding about the causes of turbulence can help you avoid the worst of it, enjoying a mostly smooth ride, hour after hour.
The Manure Maneuver
Many long years ago, when I was yet to see my 30th birthday, I pooled my meager resources with two pilot friends in the same socioeconomic stratum. We purchased a Cessna 150. It was a piece of junk.
Our first error of judgment was that we lived in Loveland, Colorado, where the local airport was a smidge above 5000 feet MSL. Needless to say, that tired ol’ 150 struggled to gain any altitude at all. In the summer months with temperatures exceeding 90 degrees Fahrenheit, it often seemed doubtful that we’d get off the ground. But we learned a trick.
A few miles off the end of the runway there was a cattle feedlot. A feedlot has dark, rich, moist soil from all the cattle effluvia. With the sun beating down on that dark soil, if we could just stay aloft long enough to reach the feedlot, we could count on some significant rising air currents, sometimes providing lift to 10,000 feet or higher.
We’d circle over that feedlot as long as we kept getting the free elevator ride, sometimes as long as 20 minutes or more. But, there was a drawback.
While the cattle effluvia served to nicely darken the soil to make the thermals that provided all that free lift, a certain fragrance also came with the ride.
Occasionally it was a contest to see which would give out first—the lift or our tolerance of the awful stench. Of course, the thermals produced turbulence to further increase our gastrointestinal discomfort. I don’t think any of us succeeded in holding our breath to the top of the climb, but we tried. —FB
Tim Vasquez, a career meteorologist, operates www.weathergraphics.com in Norman, Oklahoma.


