
METARs and TAFs have long been the mainstays of aviation weather. You’ve probably got a handy decoding guide on your desk or bookmarked in your web browser, so we won’t focus on that. However we’ll fill you in with background information—ranging from trivia to amuse other pilots on a long haul, to important tidbits that will provide insight and some options in rough weather.
(NOAA/NWS Newport-Morehead photo)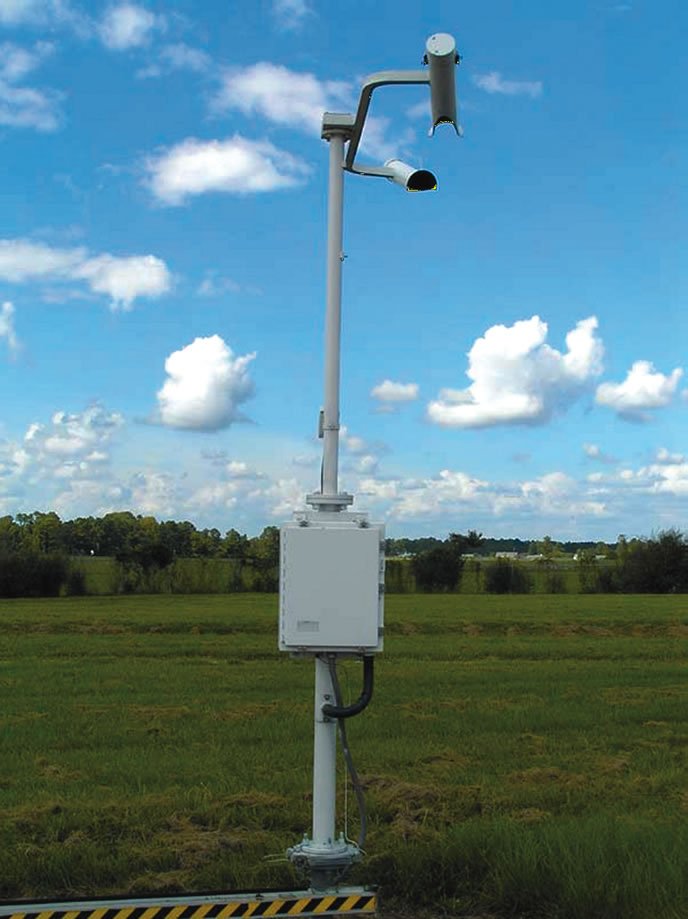
In the Beginning
The story of METARs and TAFs goes back to the 1940s when weather reports were transmitted over teletype and radiotelegraph in many confusing styles and formats. In 1948, with international cooperation at a high, the new World Meteorological Organization (WMO) set out to put an end to the confusion and unify the language of weather codes, starting with “synoptic code” used by meteorologists and merchant ships.
Aviation weather services continued using their own codes until 1965, when the ICAO and WMO cooperatively established the METAR and TAF formats and presented them at the Second International Oceanographic Conference. With this new code form, a weather briefer in London would easily be able to understand observations coming across the wire from far-flung places like Chicago, Cairo, and Moscow.
Although the world gradually warmed up to METAR and TAF formats by 1970, the United States, Canada, and Mexico were locked in their ways and continued doing things like they had since the 1930s, using “SAO” (surface airways observation) format. Forecasts were transmitted in a variation of SAO called FT (forecast terminal). As a concession, international airports coded international formats, while military bases overseas went whole hog with METAR and TAF to blend with their host nation’s airspace system.
Finally in 1996 with standardization becoming a part of government and industry culture, the U.S. dropped SA and FT and joined the rest of the world. Some more seasoned readers probably remember this difficult transition all too well.
(NOAA Photo)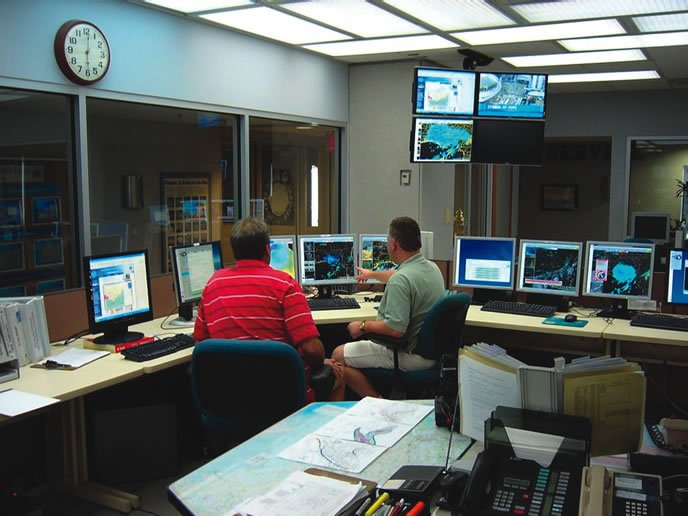
Your Friend, the METAR
So where does METAR come from? Up until the late 1990s, every reporting airport had a human observer. At big airports like Dallas Love Field, a specially trained FAA observer took the observation. At smaller airports like Addison, the control tower made the observation. This had its pros and cons. On one hand, the observer was able to see the whole sky, catch instrument errors, and type meaningful and sometimes interesting remarks. On the other hand, tired observers occasionally made coding mistakes, so that 5000-foot ceiling sometimes ended up being 500 feet. And when the station closed at night, the region turned into a meteorological void, providing no clue about what was happening.
Addressing these problems, a network of automated stations called AMOS (Automated Meteorological Observation System) was developed in 1965 by the U.S. Weather Bureau in cooperation with the National Bureau of Standards. The stations were capable of observing temperature, dewpoint, pressure and wind, but there was no information about sky condition or visibility. Only a handful of them were deployed, mainly to remote sites in the Rockies.
Sweeping technological advances in lasers and signal processing during the 1980s allowed the development of more capable weather stations that could observe visibility and sky condition, and even detect the type of precipitation. This led the Federal government to implement the ASOS (Automated Surface Observation System) in the mid-1990s. About 1000 stations were ultimately deployed throughout the U.S., putting many weather observers out of a job. Fortunately at the larger airports, ASOS stations are still augmented by human observers to make sure high-volume flight operations are not putting their fate in the hands of a single—sometimes temperamental—automated station.
ASOS Revealed
ASOS is a prime weather source for most pilots, so when an observation element is off or doesn’t sound right, it helps to have an understanding of where it came from.
Visibility, by far one of the critical pieces of a METAR report, is detected by forward scattering of an infrared beam. When the sensor detects thick fog, it receives what is like the blinding glare you see when you try to use your car’s high beams in thick fog. This is all done within a volume about the size of a closet; if there’s patchy fog or a fog bank nearby, the instrument might not detect it. Some airports solve this problem by placing transmissometers near the runways, so if you are getting runway visual range (RVR) data in the observation, you know that you can depend on the values.
Precipitation type is detected by passing an infrared beam across a gap about the size of a yardstick. The sensor observes drops and flakes passing through this gap and measures their scintillation pattern. This yields information about particle size and type. Particles smaller than 0.5 millimeter, like fog, smoke, and dust, are not observable by the system and present a special problem. When the beam appears “clear” but the visibility sensor reports less than 7 miles, the humidity value is used to distinguish what is happening. A dry environment suggests haze, while a wet environment suggests fog or mist. A set of special conditions, including high humidity and overcast low clouds, indicates drizzle is occurring.
The types of precipitation that are not identifiable by ASOS include snow pellets, ice pellets and freezing drizzle, and they may result in the station reporting UP (unknown precipitation). If you see UP, the station isn’t reporting its favorite Pixar movie but is probably experiencing one of those three precipitation types. It may also be detecting very light rain or snow and is unable to get a good “fix” on the signature.
Clouds, Wind, Temperature
Cloud coverage and ceiling are obtained by shooting a laser beam up to the zenith. Similar to radar, the system is able to easily measure the height of cloud layers. As you might have guessed, the instrument has problems when clouds are lurking near the airport. Normally winds aloft blow the clouds around, so the system can use time averaging to figure out how much coverage there is. But when winds aloft are weak, clouds will remain fairly stationary and the ASOS system will have problems accurately determining the sky condition. Of course, with a human-augmented site like Chicago O’Hare, you don’t have to worry about this.
The temperature and dewpoint are calculated from a fairly ordinary electronic thermometer and relative humidity sensor, respectively. Pressures are obtained from an electronic transducer. Wind is obtained from ultrasonic wind sensors. Up until the mid-2000s, traditional anemometers were used, but they were prone to seizing in ice storms. This type of problem is sometimes still seen at foreign airports that use automated weather stations with this old technology. At most human-staffed stations, a seized anemometer is often recognized right away and the observer literally goes outside into the freezing rain and estimates the winds with a hand-held device.
Finally, ASOS sites rely on data from the National Lightning Detection Network, a collection of 106 sensors that triangulates electromagnetic discharges. These are backfed into each ASOS site, allowing it to report whether any lightning is near the airfield, though a few sites are actually equipped with their own distance and direction sensors. Any strike within five miles of station triggers an observed thunderstorm, while lightning within 10 miles is carried as a storm in the vicinity. Any lightning between 10 and 30 miles away is reported as distant lightning.
This “distant lightning” report is worth a closer look. The term “distant” sounds innocuous and seldom is given a second thought. But, since it could be as close as 10 miles, if the wind is such that the lightning is moving closer to the airport, that “distant lightning” could be overhead when you arrive. Beware.
METAR Limitations
Though METAR and ASOS might seem to be a silver bullet for pilots doing all their flying in busy airspace like Long Island, there are still many coverage gaps across the United States. For example, a void has existed for decades in a 200-mile swath of Texas between Lubbock and Wichita Falls. Other voids exist across the Rockies, especially in states like Nevada. If you’re flying into such an area it’s often a good idea to check close-up satellite images to make sure there are no unexpected surprises.
And when you’re flying to exotic locations overseas, METAR data coverage falls off tremendously in much of Asia, Africa, Australia, Oceania, and South America. You’re generally in good shape if all your flying is at major airports, but if you are heading to GA fields that aren’t very busy, be prepared for a lack of weather data.
In those locations you will get substantially better weather data coverage using the synoptic weather data network. This is true of places like Russia, India, Kenya, Bolivia, Mexico, the Philippines, and many other countries in those regions, all of which have good (sometimes excellent) synoptic data networks but METARs only at the airports where there’s scheduled airline service.
The synoptic observation is encoded in numerical SYNOP code, which can be decoded by sight with a little practice, though you can use tools like Digital Atmosphere
The TAF
ASOS has revolutionized METARs, but no machine is currently capable of writing reliably accurate forecasts. In the U.S., TAFs are written by the National Weather Service and Air Force forecasters (including a 1990s-era Tim Vasquez).
An airport like Chicago O’Hare falls within the jurisdiction of a National Weather Service office, in this case, the Chicago office in Romeoville, Illinois, about 30 miles away. A dedicated aviation forecaster watches conditions and trends at O’Hare Airport as well as other fields in the area. They work alongside several other forecasters who are responsible for other tasks like predicting high temperatures, precipitation chances and tornado warnings. The aviation forecaster coordinates forecast problems with them, with Aviation Weather Center staff, and with the end users: controllers, dispatchers, Lockheed Martin Flight Services and National Airspace System traffic managers.
What are some skills needed by an aviation forecaster? First, of course, they must know how to use all the computerized tools available in the office. Under the supervision of a senior staff member, they train by learning proper “metwatch” techniques: using satellite data, radar, surface observations and other tools to make sure that changes across the forecast area are not missed. From there they learn how to get accurate forecasts out when communication systems go down, and how to forecast for backup terminals that might be called into use when major airports are shut down. Study programs consist of detailed modules on icing, turbulence, microbursts, low-level wind shear, fog, and aviation climatology.
With that kind of education and experience, an aviation forecaster is prepared to start composing TAFs. It all begins with a thorough metwatch—being briefed by the outgoing forecaster and using all the tools in the office to follow clouds, fog, frontal systems and changes in the weather. For example, in places like the Gulf Coast and California, a very common problem is tracking fog and low stratus during the nighttime hours. You can’t see it on typical satellite imagery, and the ASOS stations aren’t fine-grained enough to understand the extent and edges of a fog layer, so you really have to get creative.
A qualified forecaster uses tools like multispectral satellite imagery to find the fog, and knows a few tricks like monitoring changes in the radiation signature of area lakes. The aviation forecaster can also bounce ideas off the other forecasters to get a better idea of how significant the fog risk is and the impact it will have on airports as the morning flights begin.
The end result of all this is the TAF: arguably one of the best-crafted forecast products of the meteorological trade, because it’s written by a human forecaster from start to finish. This kind of attention to detail is why TAFs are not available for smaller airports in the region: there’s simply no way of covering those locations without assigning more aviation forecasters to the job or allowing busted TAFs to become the norm.
Of course, this can be challenging when you’re flying into those remote airstrips, but area forecasts (while they last) and 1-800-WXBRIEF can help you out. Plus, there’s the time-tested technique of checking all surrounding TAFs, adjusting for terrain and local features, and using radar and satellite data when available. In fact, that’s just what we forecasters do, too, for destinations outside our area. And of course, reading up on WX Smarts and other articles here will help you think like the pros when the weather is not going according to plan.
Tim Vasquez is a professional meteorologist in Palestine, Texas. He offers some extra weather training on his site at www.weathergraphics.com and youtube.com/user/timwxx.


