Maximizing Datalink
There’s plenty more to using datalink weather than, “Don’t fly through the red stuff.” By layering information, you can build a more complete picture.
Datalink weather is a staple food of most IFR cockpits theses days. And why not? It give us critical information directly into our hands to make more informed decisions in the moment.
But the pitfalls are not to be underestimated. In fact, the NTSB recently released a safety alert for pilots underlining the dangers of relying too heavily on NEXRAD imagery. We can’t remove this issue with current technology, but we can mitigate it by combining our NEXRAD with other datalink information to paint a more accurate picture. In fact, combining information is helpful in getting the most of out all your datalink weather.
NEXRAD + X
No, we’re not talking about some marketing spin on enhanced NEXRAD radar delivered to your cockpit. We’re talking about combining your NEXRAD image with other data sources to verify, refute or just adjust your belief in how accurate that NEXRAD picture is.
NEXRAD has limitations. It’s a picture of the past that could be anywhere from five to 20 minutes old even if the download time that you see is only two minutes ago. It’s a composite of several sites and times, so exact positions of precip may not be accurate. There’s filtering, so some precip might not show at all. It’s good, but it gets better when you supplement it.
It should go without saying—but bears retelling—that the best tool of all is human vision. If you can stay visual, weaving your way between storms, you won’t fly into one accidently. The point here is that too many pilots give up this tool far too readily just to comply with an ATC routing. Just like you can request “15 degrees right for weather,” you can request “15 degrees right to stay visual.” Some controllers might not get the point, so you’ll have to explain there are building cells all around and you’d like to keep them sight.
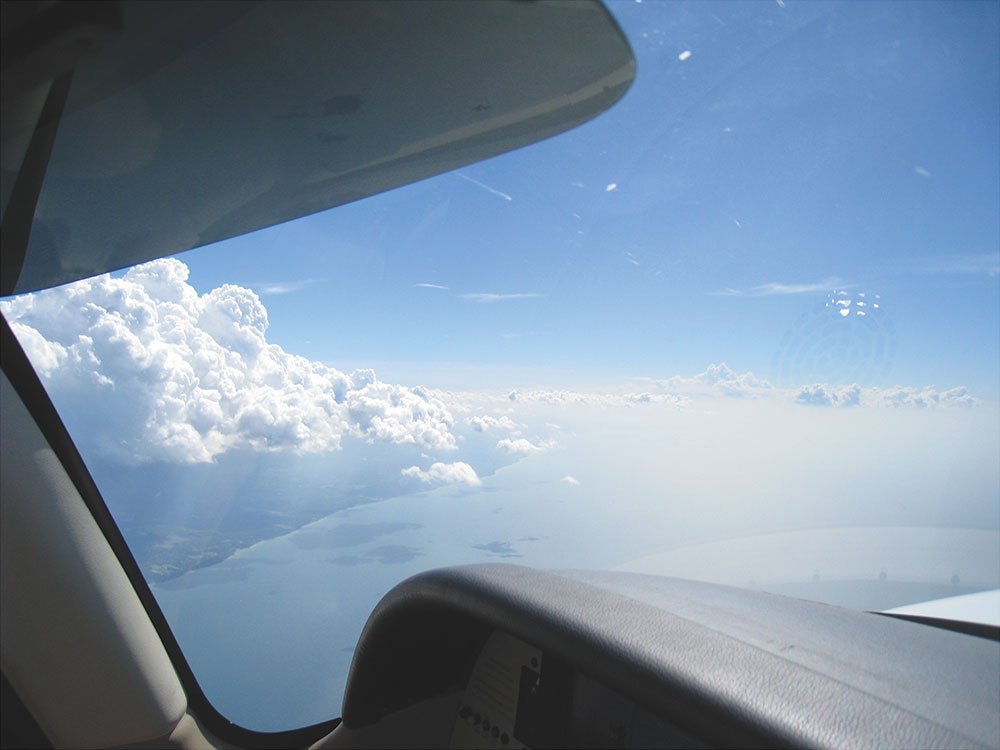
One surprising detail on this is a cell can sneak up on you visually on hazy days. Suppose you’re tooling along under IFR, but visibilities are about seven miles in haze due to the heat and moisture of the day. This is a perfect day for little pop-up storms. They form quickly, sometimes so quickly there is a hazardous cell in front of you before there’s been enough time to show up on NEXRAD, or generate enough cloud-to-cloud lightning to display on your Stormscope.
The countermeasure is to fly above the haze, or at least high enough that you can see any towering cumulus that bust out and grow above the haze. Just remember to keep looking ahead and up for those towers and steer clear of what lurks beneath.
Airborne radar is the next best thing to having your eyeballs do the work—better in some cases, such as judging the altitudes of building cells ahead of you. Newer units and avionics even have options for overlaying airborne radar on the moving map to align with waypoints, and possibly other weather data. Making the most of your own ship’s radar is an article (or several) in itself.
Controllers have real-time weather-radar capability, but it has its own limitations. The first is that the controller has to have the weather overlay turned on. Don’t assume ATC will always call out any potentially hazardous weather for you. They’re required to if they see the situation, but it’s not their primary task, so they might not see it or say it in time. That said, ATC has saved me some stress with those pop-up cells on hazy days, giving me a heads-up before I could see it myself or on datalink.
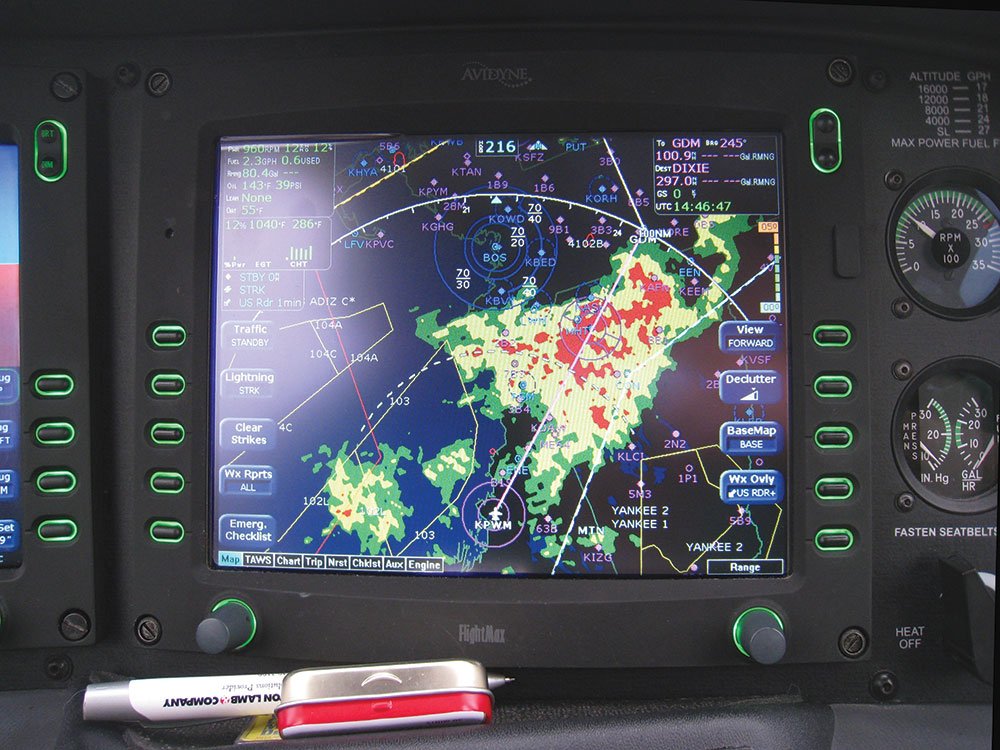
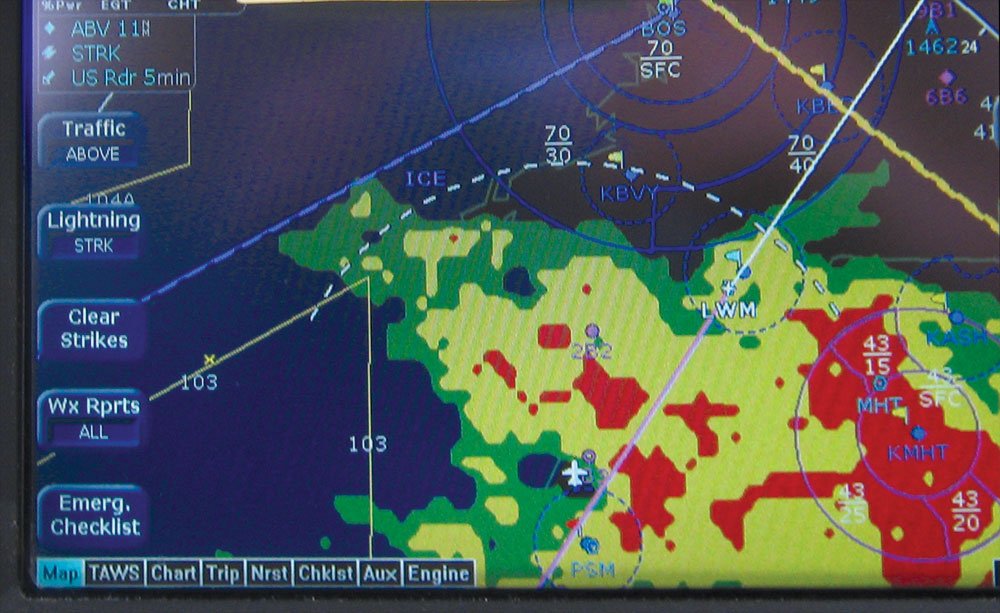
You can always ask ATC where they see precip relative to your heading to get an idea of how delayed your NEXRAD is. The images on page 6 are exactly that situation. We had fast-moving cells tracking (rather unusually) northwest. We requested a course further southeast to avoid a cell but were told by Boston Approach of a building cell there—which we couldn’t see on NEXRAD. We asked about the cell ahead and to the west, and were told he only saw it to the west. We ended up on a slight compromise route, and cruised (slowly) through what showed as the trailing edge of heavy, red precip on the MFD screen. It turned out to be hardly rain at all.
TRACON (Approach) radar can show more gradations of weather than ARTCC (Center) radar , but both have some capability. Be cautious of ATC recommendations about a gap in the clouds, especially if you’re flying slower, piston equipment (see sidebar).
It’s important to watch the direction and development of cells. You need to know which way things are moving and how much they change between updates to keep a picture in your mind of how things are developing. Remember there are usually two directions of motion: In the continental U.S., individual cells often migrate north or northeast along a front, while the entire line of cells moves with the front, generally eastward. Some NEXRAD systems display the movement and speed of cells, but personally I don’t put too much faith in these. They are most accurate for well-developed cells, but can seem almost random with rapidly developing systems.
Listen for other pilots on the frequency. Sometimes you can correlate their requests (and, occasionally, even their position if you have airborne traffic that detects their aircraft) to what you’re seeing. You can always ask ATC the relative distance and bearing to the aircraft you just heard talking about the weather.
Lightning Clues
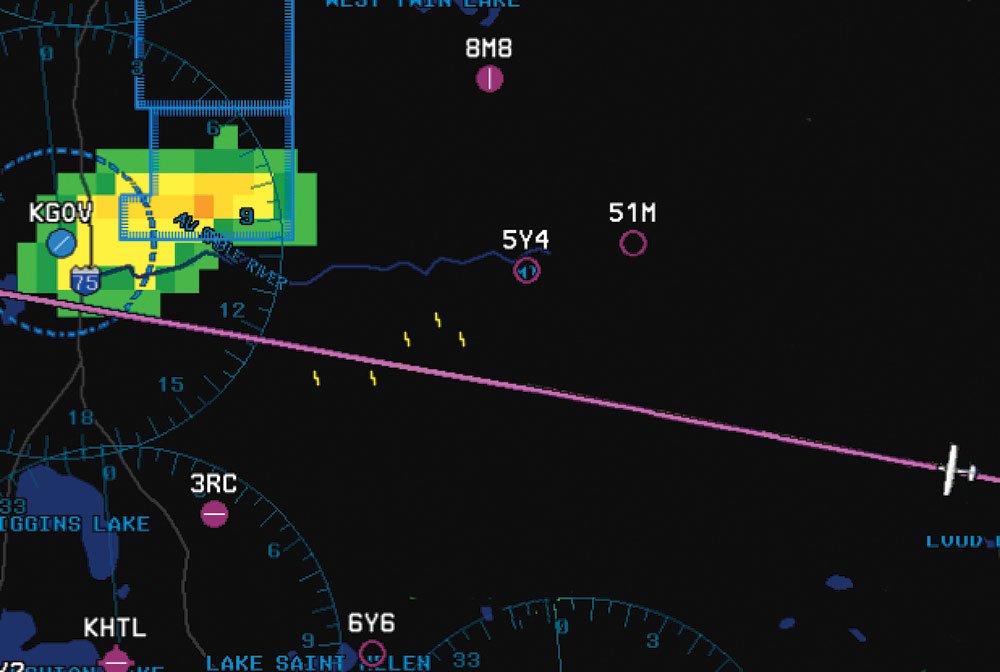
Another great tool to combine with NEXRAD, especially if you can display both at once on the same display, is sferics data (often called Stormscope data). Sferics detect actual electrical activity inside clouds and give a readout of azimuth, distance and number of returns. The big plus is that this is real-time, so there’s no delay. Also, the azimuth data is usually quite good, so you know
the bearing of the lightning relative to your aircraft.
The limitations on sferics are several-fold, but the biggest for our purposes is that the distance to a strike is essentially estimated based on the strength of the signal; the weaker the energy, the further away it’s assumed to be.
When you combine this fact with a NEXRAD overlay, however, you can build a more complete picture. If the strikes overlay well with the NEXRAD returns you’re seeing, you can be more confident in the position of both. The inherent delay in datalink isn’t warping your picture of reality too badly.
If they don’t match up, you need to look at how they don’t. Strikes ahead of the precip in the direction the precip is moving likely indicate the cell is really further along than depicted. Bolts can hit ahead of the storm, particularly in fully mature storms, but in growing cells, that’s less likely. This doesn’t mean you should plow through the area shown on NEXRAD, believing there won’t be anything there. Instead, it means you shouldn’t jump in front of that cloud where you think it looks clear. It’s not clear. The NEXRAD is delayed, and it’s moving that way.
Strikes painted on the display nearer than the likely matching precip may indicate the strikes are stronger than average. Give this cell extra space. Strikes painted farther from you than the likely matching precip may be weaker than average. Any lightning means the presence of at least some hail, so you don’t want to go there. But extra room circumnavigating such a cell probably isn’t necessary.
Use of sferics is worth its own article, but I will say that for this kind of matching up I prefer the more sensitive strike mode to cell mode. That’s especially true with newer devices that seem to have a higher threshold for showing any strikes at all. This may be different with the very latest devices, such as the newest one from Avidyne, but I haven’t used these in a convective environment yet.
Note as well that we’re talking about airborne lightning, not datalink lightning. Datalink lightning has a similar delay to NEXRAD, so it may give you false confidence when strikes match with NEXRAD cells. Most datalink lightning is also only cloud-to-ground strikes. In a building, convective situation, the cloud-to-cloud strikes are what you need to see. Often these will appear before there’s a NEXRAD return at all.
No matter what you do, it’s always good to assume some delay in cell position and plan to pass behind rather than in front of cells. Never jump in front of the freight train.
How Yellow Are Ya?
Ask a group of pilots how comfortable they are flying through a yellow NEXRAD return and you’ll get everything from bored yawns to nervous shudders. The difference is between those who’ve been bitten by an innocent looking area and those who haven’t.
Flying is a continuously evolving risk assessment. If you choose to fly through returns in the 30-40 dBZ range, you will be flying through some real rain and might be in for some serious turbulence. If the risk isn’t worth the gain for you, don’t go there. However, if you’re not totally risk averse, there are clues that will stack the odds in your favor to get through yellow without unsecured items striking the cockpit ceiling.
First off, you should know your system’s color coding. Most systems paint returns in the 10-30 dBZ range as some shade of green. Lacking any other clues for convection, these are almost always reasonable returns to fly though in an IFR-equipped aircraft.
Yellow is trickier. Systems often paint 30-45 dBZ in some shade or shades of yellow. Anything over 45 dBZ is usually convective, so it’s good to know where 40 dBZ is and make that your limit. Your system may or may not give you that level of resolution.
But there are other clues. A big one is contouring: Radar returns that show a rapid change from green to yellow (and red) over a short distance usually indicate convection. Convective yellow is to be avoided, as it’s more likely to be turbulent and it’s more likely to become red in the next few radar updates. I call this “contouring” because it reminds me of contour lines on a topo map: Closely stacked lines equate a steep hill; closely stacked color changes usually equate a nasty storm cell.
On the other hand, wider bands of green that morph raggedly into wide swaths of yellow are usually the rain that’s rough on your prop tips, but won’t make you ill. Supporting clues are areas that steadily stay yellow, neither raining out nor getting worse. Slow or no cell movement is also a good indicator that you don’t have convection going on. None of these are guarantees, but they give a pilot willing to take a reasonable risk much more confidence.
It’s also important to know if you’re looking at base or composite reflectivity. XM Weather uses the latter and this is more likely to tease out building convection because it will show heavier returns aloft that simply aren’t reaching the bottom of the cloud yet. You may be flying through the lower cloud (usually the layer used by base reflectivity systems) where there isn’t much rain but still get rocked from the updrafts that are suspending heavier stuff above you.
Surficial Thinking
Correlating other data with your NEXRAD is the big-ticket item here, but there are other corners of datalink where putting together bits of information can give you an edge that reduces both stress and risk.
Take this scenario: You’re cruising along with a nice tailwind and your GPS and fuel computer show you’ll have sufficient fuel to continue non-stop. But that calculation is based on your tailwind-boosted groundspeed and you know you’re going to cross a front. But where is it, really?
METARs update about the top of the hour, so by scrolling around the available METARs and looking at the big picture of the winds at the surface, you can often see where the front was at the surface at that update time. Catch two of these, as you might on a long trip, and you get an idea how fast it’s moving. If you know whether it’s a warm or cold front—and you should from your preflight investigations—you should have an idea of which way it slopes. I find this information often more accurate than the predictions I picked up when I checked the weather before the flight.
That picture can have several uses. You may be able to delay your descent, knowing your tailwind aloft will be available almost to your destination. Or the reverse may be true. You and a front are on a collision course, and you can see by where it is already that you’ll cross it soon and lose the groundspeed push. It’s time to start planning a good fuel stop. If you have an older Avidyne system or similar that can’t scroll around like a G1000 can, an ADS-B portable might be a better (cheaper) way to add this ability to check more METARs off your route.
Watching the timestamps on the METARs is crucial. This is all historical data; you must see how old the information is and extrapolate to the present. The surface-front position via METAR can also be combined with NEXRAD, and can help if the cells are building on the front. It’s not a perfect picture, but between the two pictures (one the age of the METARs and one the age of the NEXRAD) you could get a rough idea of how fast the weather is moving when those times are, say, 40 minutes apart.
Remember as well that TAFs are limited to the area immediately around the airport by design. This is particularly true when predicting thunderstorms in the area. Don’t count on a nearby TAF to necessarily predict thunderstorms rolling through. Look for other clues, like gusty winds or visibility reductions in haze, that convection is on some forecaster’s mind.
Get Creative
Remember as well that there are a lot of other aircraft flying around with their own datalink and real-time data. Just like you could ask ATC how that Cirrus ahead of you and 2000 feet higher is enjoying his ride, you could ask what that Cirrus sees for winds aloft. The pilot should be able to read it right off the PFD.
The point is that information is best consumed as a complete meal. Rely too much on one thing and it will let you down sooner or later. Take it all together and you’re more likely to have a satisfying—and safer—experience.
Walking in someone else’s shoes
I’m not a big fan of taking ATC suggestions for flyable gaps in storms. There are just too many variables. I don’t know that the controller has been following storm development and has any sense of how quickly it will close. ATC might relay that another plane went through the gap just five minutes ago, but I don’t know what that pilot’s aversion to storms is, or what their passengers will accept for turbulence.
The aircraft type also matters. There’s a big difference between seizing an opportunity to fly through a gap in precipitation at 350 knots, when traversing it will take 10 minutes, compared to 170 knots, when it will be more than 20 minutes, let alone 120 knots.
I’m more confident with ATC suggestions when I know from my own data that I’m heading around the trailing edge of a storm or cell. I like a steer where I can approach at an angle, like a mountain pass, and an option turn and run away up to the last minute before committing to fly through.
Controllers are trying to help, and none would ever steer you into danger knowingly. But they’re trying to move you across their airspace and might not have a more complete picture than you do. Take the information for what it is: A suggestion you can accept, modify or decline as you see fit. —JVW
Jeff Van West loves his steady diet of datalink. He can tell because he gets a stomachache every time he has to fly without it.