
We’re getting into some of the most predictably pleasant flying conditions in the U.S. That’s not to say we can’t get the occasional hurricane bearing down, or a cloud-filled clipper sweeping down from the Dakotas. But as autumn arrives, days are getting shorter, the broad-scale heat-driven cyclone in the western United States is much less intense, and the onshore wind component between the oceanic highs on both coasts and the inland areas dies down.
Reduced surface heating means that diurnally-driven thunderstorms are less aggressive. And for most of the western and southern U.S., this means lots of VFR conditions, especially early in the day.
So, with little seasonal weather to talk about, we can review some rules of thumb. You learned many flight rules of thumb, but in meteorology we have many of our own. This is how we distill the wisdom of retiring forecasters and guide our sense of intuition as we go through the charts. Let’s look at some weather rules of thumb and cover a little meteorology along the way.
Magnetic Versus True
If you read the winds, they’re true; if you hear them, they’re magnetic. This is probably more of a piloting than a meteorology rule of thumb, but it’s an important distinction to make sure we’re speaking the same language.
In meteorology, especially with METAR reports and centralized products, forecasters always work with winds oriented to true north. Whether it’s METAR winds, TAF winds, public wind forecasts, storm motion, and which way the tornado is moving, we use true north. Wind information broadcast over an ATC frequency, however, is tailored for your compass and will be magnetic.
This isn’t much concern in the Midwest or the southeast US where declination is small, but if you’re in the Northeast or the West Coast, declination increases to as much as 15 degrees, and can have a noticeable effect on your flight.
Grasping the Winds
Understand what is causing today’s winds, and you’ll grasp the rest of the forecast. Don’t just react to the wind information you receive. Dig into it. Are the winds driven by continental or oceanic-scale circulations? Are they driven by a weather system a few hundred miles away? Is sea breeze involved? What about old storm outflow? Are mountain and valley breezes involved?
All of these have different scales, ranging from hours and a few miles with the mountain breeze to thousands of miles and days to weeks with trade winds. Knowing which circulation normally affects your weather and which is dominant at the moment is what I would call one of the secrets to understanding the forecast. If the wind direction is normally 150 degrees on September afternoons, seeing 120 degrees tells you the wind is driven by something different.
Consider picking up a good meteorology textbook like Ahrens’ Meteorology Today, or the downloadable FAA Aviation Weather book, or (of course!) one of mine. They all have introductory chapters on what drives basic wind circulations.
Boundaries Favor T-storms
Frontal boundaries and boundaries along old squall lines are favored areas for clouds, showers, and thunderstorms. This is a great rule because instead of focusing strictly on fronts, we’re looking at any transition zone in the atmosphere.
What do we mean by boundaries? We’re talking about any discontinuity in the air mass between two areas. This could be one air mass having fog and the other dust, or one air mass having high humidity and the other low humidity. But two boundaries really matter: convergence boundaries, where winds are different and tend to come together, and thermal boundaries, where one side is homogenous and warm, while the other side transitions over to cool air.
Think of convergence boundaries like traffic. If you have a pack of 100 cars storming along the freeway at 70 mph, and another 100 cars ahead driving at a leisurely 30 mph, there’s going to be a pileup and some cars are going to be thrown in the air. This is just how air behaves, so forecasters look for surface convergence because it means air is going to rise, producing clouds and maybe precipitation if the humidity is high enough.
And thermal boundaries have ways of reinforcing themselves and scaling up, and influencing upper-level patterns. This further strengthens the contrasts. This is why fronts are important. Air mass boundaries near the surface almost always mean upward motion.
Even our best computer models don’t handle the fine details of boundaries very well, so when we’re looking ahead less than three hours we usually just look at surface charts, satellite data, and radar to track what they’re doing and how fast they’re moving. You can do the same; boundaries are easy to identify with a little practice, and the Aviation Weather Center website offers METAR data plots that will give you up-to-the-minute details on where they are.
Tim Vasquez
Boundaries and Thunderstorms
Thunderstorms will usually dissipate if the outflow boundary moves more than 40-50 miles away from the storms. Storms always have an outflow region in and near the precipitation core, which is the outward movement of downdraft air away from the storm. The outflow is ring-shaped, and can sometimes be seen on radar or inferred from ASOS reports. Sometimes you can see it from the air kicking up dust. Very tight, concentrated outflow pools are known as microbursts, but otherwise we just call it outflow.
When an area of storms is active and producing severe weather, the outflow boundaries tend to be drawn close to the storm or will concentrate on the storm’s back side. But when storms are dissipating, the outflow boundary will start pulling away 20, 30 miles, and even further. When the distance gets over 40 miles, especially on the south or east side, and you see no new redevelopment near the boundary, this a good sign that the storm cluster is dissipating.
Radiation Fog
If rain has fallen yesterday afternoon or evening, expect fog by dawn if skies are clear and winds are light. This is an especially valuable rule. It works worldwide. Moisture in/on the ground and vegetation gradually evaporates into the air, converting the liquid into water vapor. This raises the dewpoint of the air, making it several degrees higher than normal. Meanwhile a clear sky at night means rapid cooling from the Earth radiating its heat into space.
When the temperature falls to the dewpoint, the atmosphere can no longer accept moisture, and it becomes liquid droplets suspended in the air. What happens to these droplets is where wind speed comes in. (More rules of thumb.)
If winds are over 10 to 15 knots, a low stratus layer tends to form, producing low ceilings. But if the winds are weak, less than 10 knots, the water droplets tend to hang about near the ground, resulting in fog and restricted visibility. Interestingly though if the winds are calm, there is a chance the fog may just deposit the moisture onto foliage, runways, and airplanes, producing a very heavy dew and little fog.
This should give you a better idea of when to expect fog and how long it will last, which is better than waiting on TAF amendments.
Colorado Lows
When there is a strong Colorado low, stratus will move rapidly north across central and east Texas and eastern Oklahoma. This can bring IFR ceilings to places like Dallas, Houston, Austin, and Tulsa. Normally Gulf stratus hangs around the coastal regions. However when a strong upper-level jet stream develops perpendicular to the Rocky Mountains, the lee-side cyclogenesis effect helps produce a broad area of low pressure in Colorado and deepens these systems.
In response, tropical air from the Gulf marches north and brings low ceilings. This stratus and stratocumulus can reach as far west as Lubbock and Amarillo, and as far north as southern Nebraska. These cloud bases are lowest at dawn, lifting by late morning and breaking up, but with a strong pattern during the cool season, much of Texas and southern Oklahoma can remain MVFR all day.
Upstream Dewpoint
If the temperature at your station will remain cooler than the upstream dewpoints, expect low clouds and fog. This is a rule of thumb for advection fog and advection stratus. It works well for Colorado low situations, but can also apply to any other place in the U.S. Normally with this rule you can expect fog from about 3 to 10 a.m. and stratus at other times of the day, but a strong inversion can allow fog to persist through the day.
Imagine it’s 9 p.m. and you have a morning flight out of Oklahoma City. Winds are from the south-southeast. Local temperature is 62 degrees with an expected high tomorrow of 72. The dewpoint in Houston, to your south-southeast, is 73 degrees. If you remember our fog lesson about temperature and dewpoint, it’s the same principle, except this is in the horizontal. Looks like a risk of IMC in Oklahoma City in the morning.
This works best if winds are moderate to strong, and your temperature remains below the upstream dewpoint for the entire forecast period. If afternoon temperatures will rise above that value, it means low clouds or fog will erode quickly. This is why in the summertime, with dewpoints near 72 and afternoon highs near 90 degrees, it’s unlikely anywhere to get any persistent stratus and fog through the day. But with winter, it’s a different story.
Movement of Weather Systems
Surface frontal lows and highs move at about 50% of the speed of the winds at 18,000 feet (the 500 mb level). This is one of the most basic rules of thumb, and it relates movement of surface systems to the jet stream.
It’s also very easy to apply: if the winds aloft charts show 40-knot winds at Chicago at 18,000 feet, you can expect any highs and lows near Chicago to be moving at 20 knots. This rule can be applied loosely to fronts, though the tail ends of fronts will tend to move at a slower pace.
NASA/EOSDIS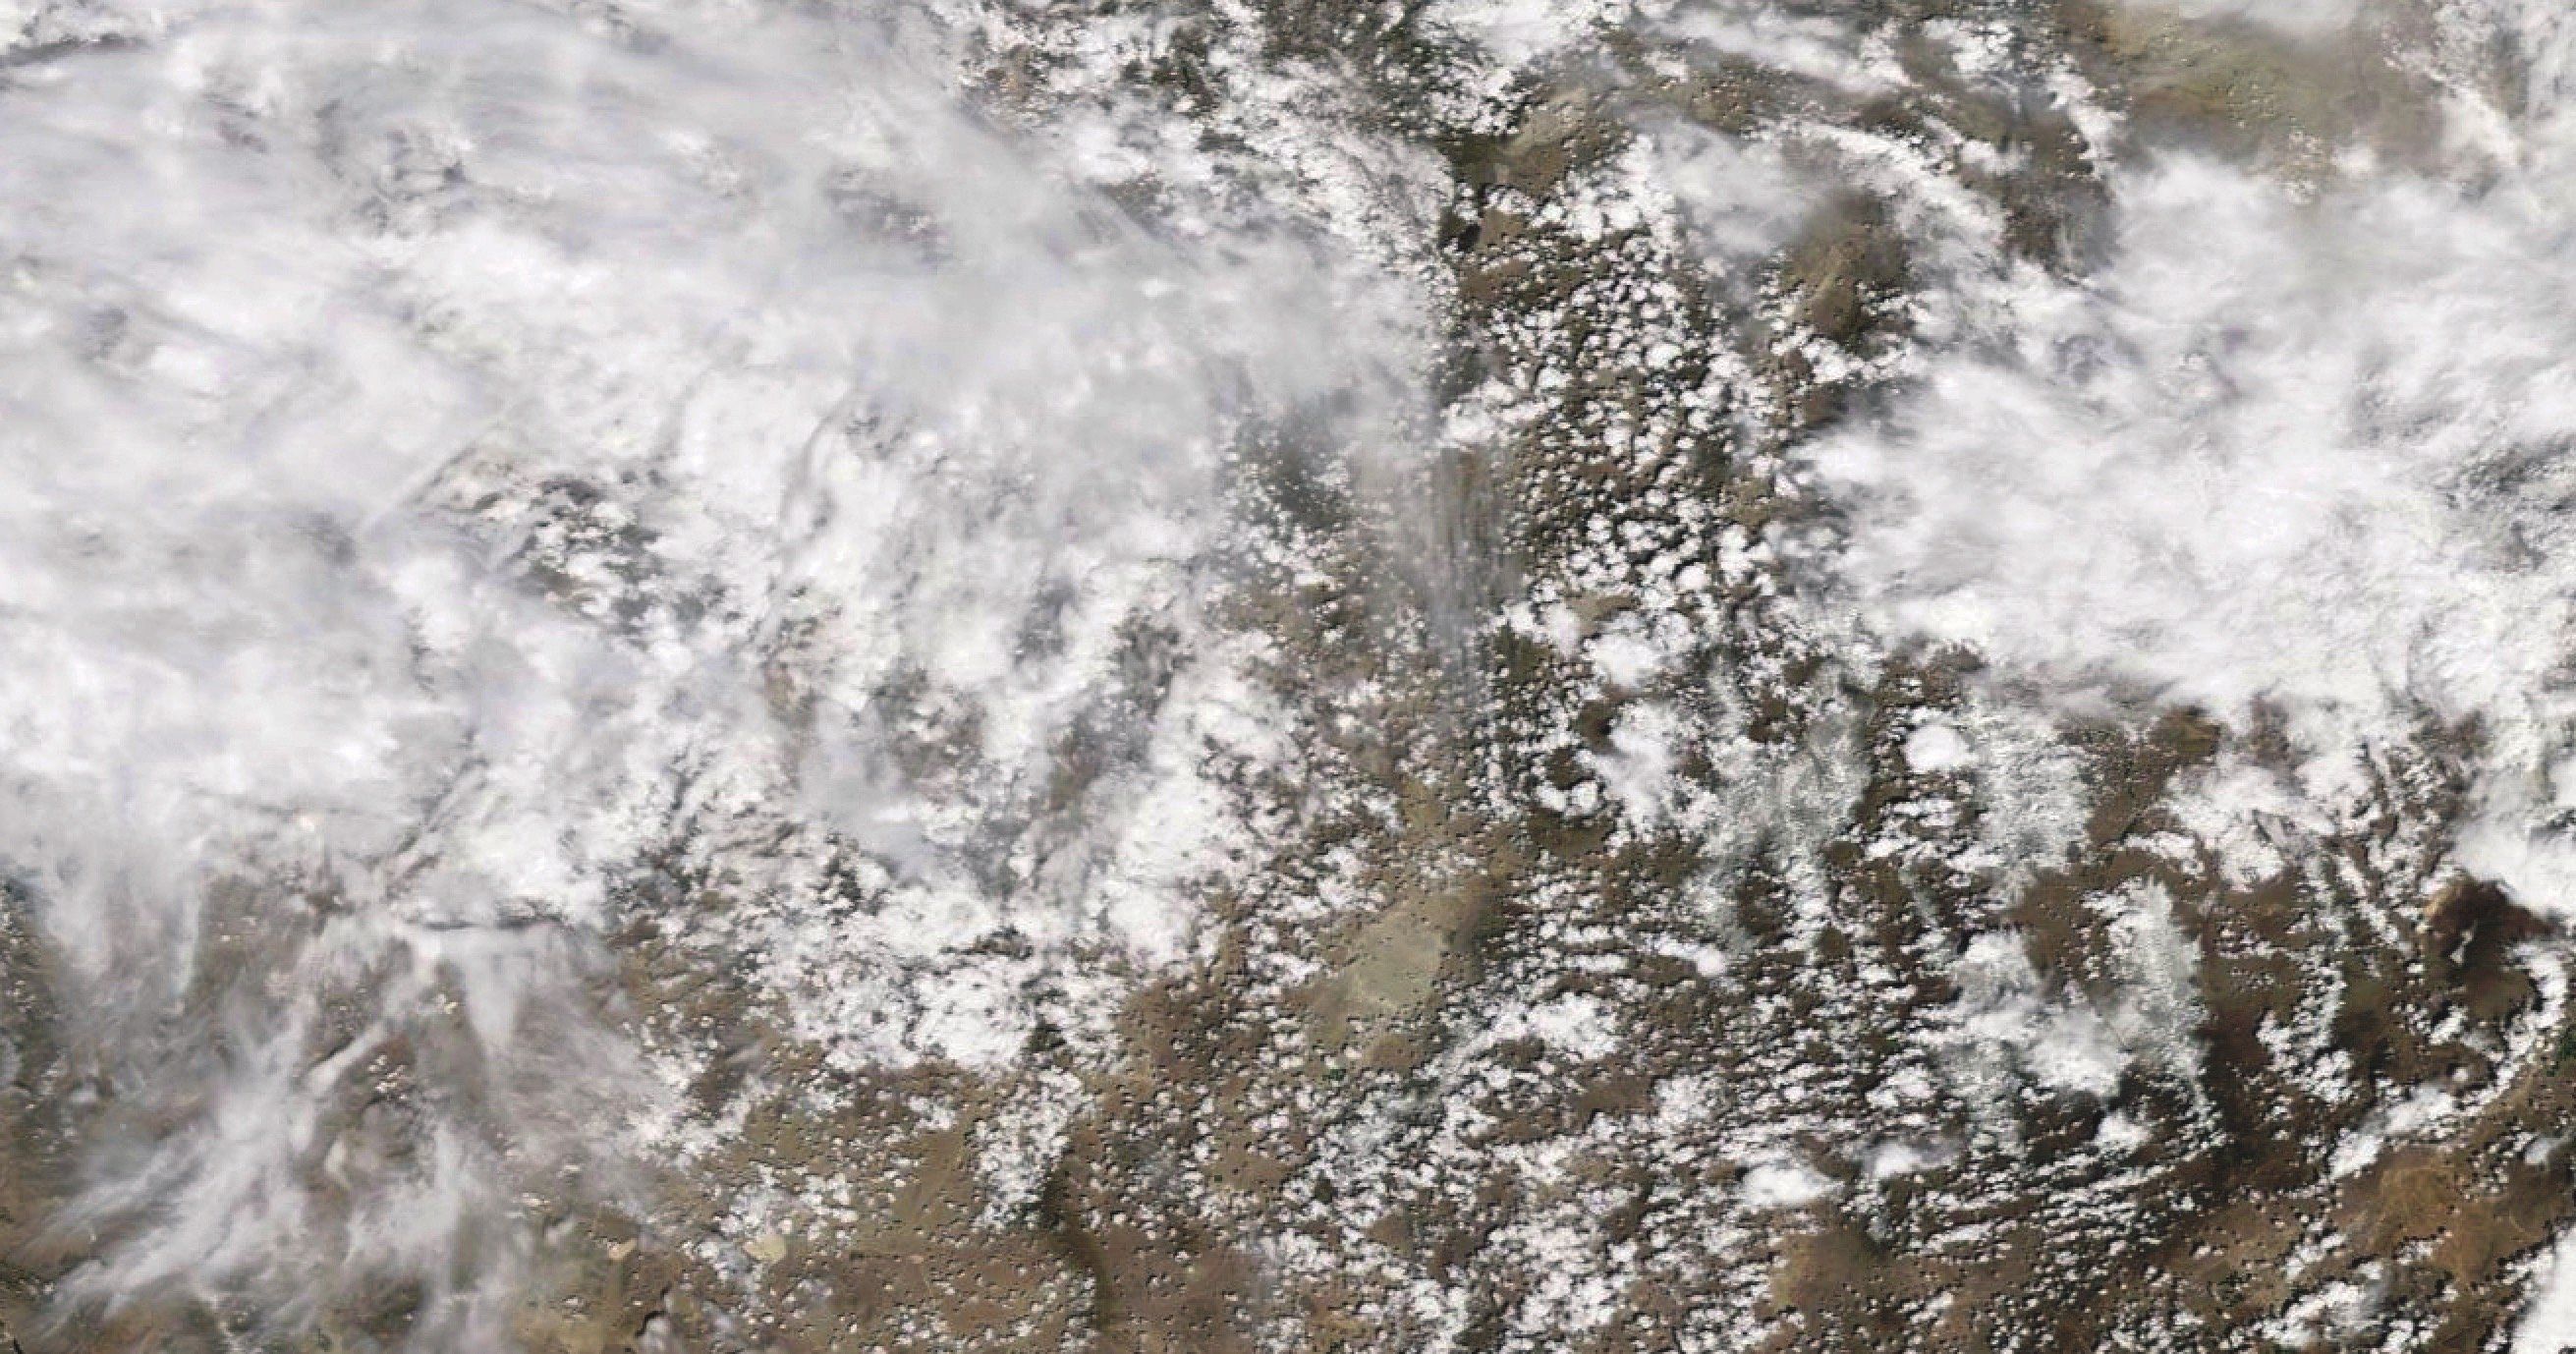
Tracking the Rain-Snow Line
The 5400-meter thickness line on the 1000-500 mb thickness chart usually separates rain from snow. This thickness chart is easy to find with Internet searches or just by visitingweather.cod.edu. and the chart can be thought of as an “average temperature” between the surface and 18,000 feet at each point across the region. In that respect, it provides a truly realistic picture of how warm or cold an air mass is.
So by tracking the 5400-meter (540 decameter) line and monitoring changes in the thickness at your favorite airport, you can get a good idea of what the air mass is doing and see how prone you are to seeing snow should conditions go downhill. This chart is especially useful in the 7-to-14 day range, when the models tend to be unreliable with precipitation placement but fairly good with positioning the thermal structures in the atmosphere.
Precipitation Near Cold Lows
Upper-level lows bring showery precipitation during the day that dissipates at night. It’s common for upper-level lows to move across the United States, especially during the cold season. Upper-level lows, which can be found on jet-stream level charts, normally have cold air near the center, thus we often call them “cold core lows,” and because of cold air aloft and warm air near the surface, the atmosphere tends to be unstable in them. These cold lows are normally found on surface charts near occluded fronts.
The precipitation, likewise, is strongly driven by daytime heating. Rain showers, snow showers, or low-topped thunderstorms normally break out during the afternoon, peaking in late afternoon, and they rapidly die off around dusk, leaving mostly mid-level cloud layers.
Fortunately the visibility near cold lows is fairly good since dry air tends to be entrained into these lows, and you shouldn’t have much IFR or MVFR flying except in and near the showers.
Low-Level Wind Shear
If you see a significant difference in the winds between the ground and 2000 feet AGL, expect low-level wind shear (LLWS). Your information might come from a combination of winds aloft charts, METAR observations, and PIREPs. Meteorologists will typically use soundings (skew-T charts) and hodographs to spot LLWS conditions, along with radar velocity wind profiles and mesoscale models. But the simplest sources can work, too. Even comparing the wind sock to stratus movement will give you very valuable information about what’s going on just off the ground.
Not Just Computer Models
As you can see, weather forecasting is not all about computer models. That’s a one way ticket to failure. It’s quite important to comprehend what’s happening and applying experience, intuition, and meteorological understanding. Rules of thumb are an effective way to get you started.
And the rules of thumb vary from simple ones to highly technical ones. I’ve chosen some of the ones most relevant to aviation forecasting. Hopefully you’ve found one or two good ones to help you stay safe.
At home in Palestine, Texas, Tim Vasquez is often accused of being all thumbs. Perhaps that’s because he’s memorized so many rules of thumb.


