
Preflight weather planning has long consisted of calling an FAA Flight Service Station. Years ago, you might have even visited one. But, using the Internet, you can now draw on the same resources that meteorologists use. While the 2000s brought weather data to the cockpit, we’re now getting some Internet tools to the cockpit via dedicated datalink. Although we can’t yet cheaply surf the web at cruise, we connect to the Internet at the FBO, on the ramp and in the plane on the ground, using phones and tablets with WiFi and cellular data.
We’ll review an assortment of websites that are useful for your preflight weather review. If it’s good VMC, you probably won’t need these sites, but when fronts and weather systems threaten, you might very well use these to put the forecast into perspective and help you plan for the unexpected.
A word of caution is in order. The FAA has only officially blessed a few weather information sources, but there are many useful websites that may not be officially certified. When using unofficial websites, make sure you also visit an official one and assure consistency. If in doubt, the official sources always take precedence. If you can’t make sense of the situation, use official resources or contact Flight Service.
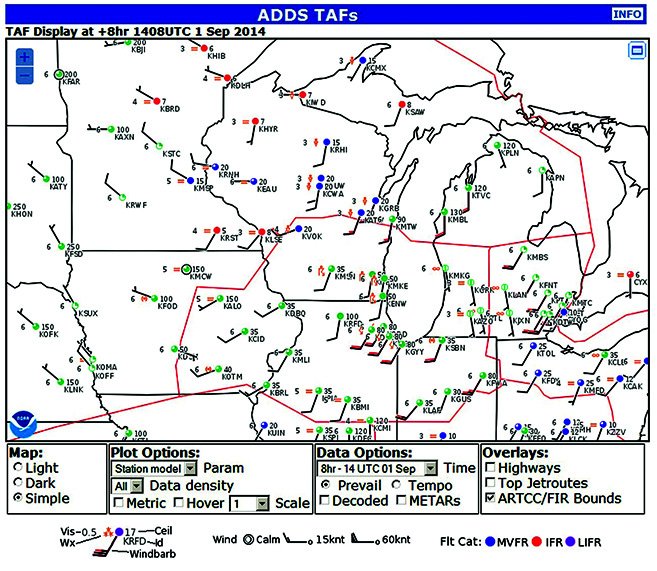
Aviation Weather Center
The Aviation Weather Center (www.aviationweather.gov), should be your first stop. It provides official weather products, putting the most important tools on the front page. This includes an excellent TAF viewer and viewers for METARs, SIGMETS, AIRMETS and PIREPs. This saves you the trouble of decoding reports individually but, you can still click on an individual plot to get the detailed report.
On the dropdown menus, you can look at more specialized products like those for international flights and radar products for national mosaics and single-site images. It’s a great idea to look at all these links and note those that you think might be most helpful to your particular type of flying.
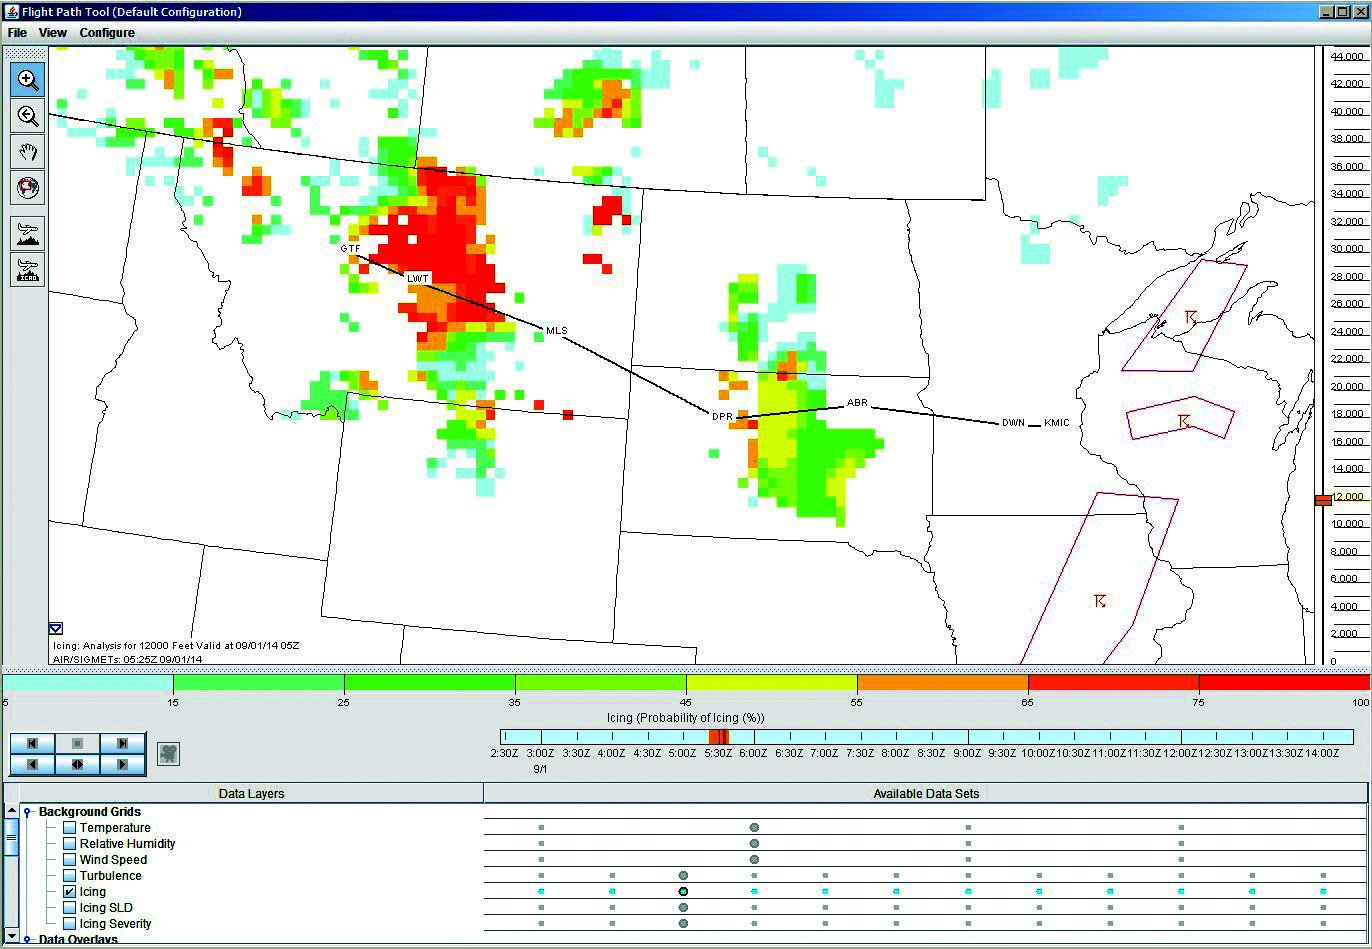
ADDS Flight Path Tool
At www.aviationweather.gov/flightpath there is a 4-D viewer. Designed for pilots, the ADDS Flight Path Tool shows the weather vertically and horizontally. It also allows you to move back and forth up to 12 hours in the future. As you plot your route, you can view all the weather phenomena and hazards that will affect you. The available data includes icing, turbulence, wind data, SIGMETs, temperature and more. This tool primarily uses data from the Weather Research and Forecast (WRF) Rapid Refresh (RR) model.
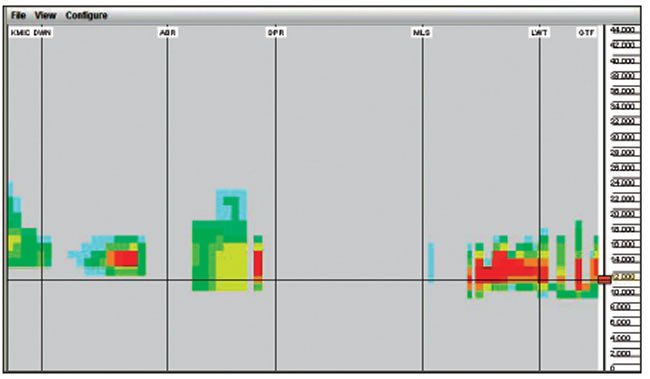
Once you launch the flightpath tool you’ll see two buttons with airplane icons on the left side. The top one lets you draw a route graphically; the lower one lets you type the route fixes. Once the route is drawn, the tool also displays a cross section. Settings changed on either the map or the cross section affect both. This is a great way to tweak your route and avoid the worst of the weather.
Remember not to use the METAR overlay for the future—plotting current observations on the forecast map will present an incorrect picture of future conditions. To see weather at the time of your flight, use the TAF overlay. Hover over the stations to see the TAF data. The Aviation Weather Center homepage has a better graphical display of METARs.
National Convective Weather
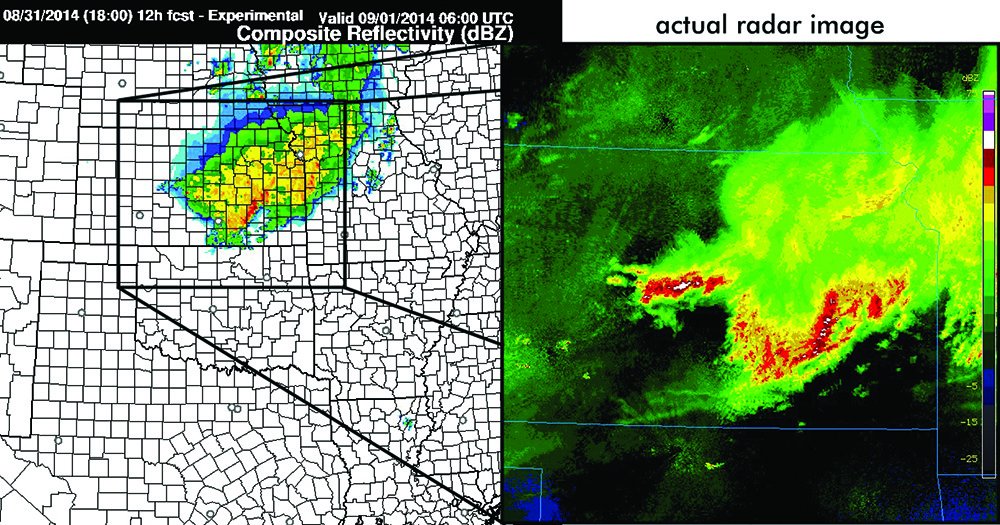
The National Convective Weather Forecast (www.aviationweather.gov/adds/convection) is an innovative system that extrapolates national radar data up to two hours in the future. It blends observed radar data with lightning data and fields from available models. It incorporates modeled behavior such as dissipation of “air mass” storms at dusk.
The forecast product performs well with long-lived, mature systems. It is helpful for checking weather at a destination airport when storms are expected to move into the area and the timing is in question. However, the initiation, growth and dissipation of these systems, as well as shorter-lived isolated storms, are not handled well. Keep in mind that even though this product is indeed generated by government agencies, it is not considered a replacement for an official aviation weather briefing.
Storm Prediction Center
When planning a flight, there is often a tendency to focus only on weather at the departure and arrival times. You arrive at your destination, close your flight plan and call the flight safely completed. But just as it would be folly to park in Florida in August without looking at hurricane tracks, the same mistake can be made in other places at other times when there is a reputation for severe storms.
Though it’s not likely your plane will ever be hit by a tornado, there is risk of getting battered by large hail and high winds. As it is, this kind of damage reaches billions of dollars each year in the United States, with airport ramps often taking much of the beating. Specific problem areas are the Gulf Coast region in the winter; the central U.S. and central Mississippi River region in the spring and fall; and the High Plains, the Midwest and Great Lakes region during the summer. If your destination matches one of these areas, it pays to do a little extra checking.
The Storm Prediction Center (www.spc.noaa.gov) has products to look for damaging storms up to three days ahead. You’ll want to look at the convective outlook product; it is constructed manually by some of NOAA’s most talented meteorologists. Risk levels are none, general, slight, moderate and high. This indicates the probability that a severe storm (including 50-knot winds and 1-inch hail) will affect a specific area. It’s the moderate and high risk areas that should concern you most, as they indicate the potential for severe storms. If you’re in a slight risk area, you’ll probably be fine.
High-Resolution Rapid Refresh
The High-Resolution Rapid Refresh (HRRR) site (http://ruc.noaa.gov/hrrr —no “www”) is the replacement for the old RUC (aviation) model. It is a version of the widely-used Weather Research and Forecasting model and runs every hour at a resolution of 3-13 kilometers, depending on the configuration, using a combination of data from the previous run, observed data, radar data, radiosonde data, inflight data from various aircraft and much more. This gives forecasters a rapid-fire update that uses as much real-time data as possible. Although forecast errors do occur, especially with fast-moving systems, most forecasts produced by the HRRR are quite accurate.
To use the site for preflight weather, choose one of the versions found under “Forecast Graphics” tab at the top left of the home page. You’ll be given a list of fields from now out to 18 hours in the future and you can zoom in on any of eight areas in the United States for a closer look. The composite radar, wind panels, ceiling and visibility forecasts will be of the most interest to pilots. The precipitation areas are not always accurate, especially more than 12 hours out, but they represent what is probably the best available model data for forecasters.
MeteoStar
The MeteoStar model (wxweb.meteostar.com/models) provides an assortment of high quality information-rich model data from the NOAA global forecast system (GFS) and North American mesoscale (NAM) models. The most important highlight of this website is coverage for the entire world. Most of the GFS panels offer forecasts out to 16 days, making it useful for long-range flight planning.
That said, it’s amazing to get a spot reading of wind speed and direction two weeks from Tuesday, but it’s important to remember that accuracy for all models drops off sharply after 7-10 days.
No matter how much computer power we throw at forecasting, the atmosphere is ultimately non-deterministic. With radiosonde launches hundreds of miles apart over land and thousands of miles across the oceans, it’s astonishing that the models perform as well as they do. Accurately initializing a forecast model with such limited data is, to us meteorologists, a great achievement of modern science.
Pilots will find the products quite accurate out to 48-72 hours. The panels that are most useful include the icing, turbulence and wind frames. The precipitation panels are a good proxy for radar imagery. The relative humidity panels are an excellent proxy for cloud material at a given altitude—values of 70% or more suggest clouds are likely. The site is targeted at meteorologists, but a sidebar tells you how to convert millibars to altitude.
One thing to keep in mind is the low-level data will be somewhat degraded over areas where the atmosphere is poorly sampled, plus the low levels are driven by convection, which is more difficult to accurately model. Since precipitation, fog and ceilings are mostly tied to low-level processes, the forecasts for those phenomena will be similarly hit or miss. It’s more important to consider areal and chronological trends and general locations, as otherwise trying to read too much into the details is like looking at the proverbial elephant through the magnifying glass. Over well-sampled areas such as the United States and Europe, small details will show more accuracy.
Lightning Maps
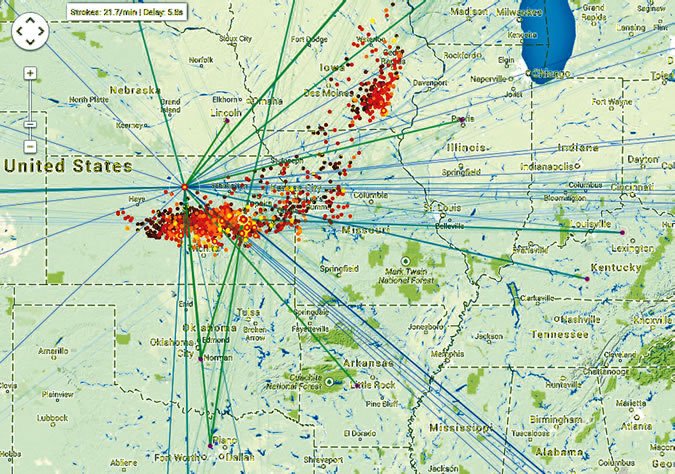
An amazing new site, www.lightningmaps.org, uses the Google Maps interface to show live lightning strikes with a delay of only a few seconds. Each lightning strike appears on the map as it happens, with radials extending in all directions to show which stations were used to triangulate the strike. This data comes from the Blitzortung lightning project—a network of 1100 low-cost hobbyist-owned detectors that transmit data over the Internet to a central server. The accuracy varies from excellent to several miles, depending on how many stations are nearby, and is bound to improve as more stations are added.
If you have a mobile Internet connection on the ground or in the air, this website can give timely warning of increasing lightning activity and show where it is occurring. During the summer, a quick check before taxiing out can help alert you to any surprise cells that are developing in the area.
As with any lightning detection product, strong clusters of frequent strikes usually correlate to a strong thunderstorm cell. It must be remembered that the system detects mostly cloud-to-ground strikes, and since some of the first strikes in a new storm occur mainly within the cloud, the site will not give much warning of new cumulonimbus clouds until precipitation is about to reach the ground.
And that leaves one important caution: If you are somehow getting Internet data in flight, do not use lightning maps to pick your way through the thunderstorms. Though some strikes are triangulated accurately, others are not, and the product as a whole is not accurate enough for this kind of navigation.
The Internet gives you access to timely radar graphics, which are more suited to navigating storm areas and are more dependable. The lightning data should be used mainly to alert you to new areas of storms and to monitor overall trends in cell development and movement.
Tim Vasquez is a professional meteorologist in Palestine, Texas. See his website at www.weathergraphics.com.


