
Twenty years ago, the idea of carrying sophisticated digital radar in anything under a medium twin would probably have been met with roars of laughter, but technology has brought amazing advances. Now it’s possible for even an ultralight pilot to use the Internet to access essentially the same tools that are available to forecasters.
In the United States, the ground radar network has become so dense and reliable that it’s largely done away with the need for airborne weather radar for anything short of real-time dodging and weaving through an area of cells. Of course none of this radar technology will help a pilot flying to vacation spots in Cancun or St. Vincent, but on a typical cross-country flight, the amount of weather data at your fingertips can be overwhelming.
Radar Basics
Getting the most out of radar requires an understanding of how radar systems work. You may have once learned the basics of radar, possibly using the popular analogy of a bat emitting chirps in a dark room and judging distance by the time it takes for the sound wave to echo back.
The underlying principles of radar haven’t changed a bit. Radar antennas emit a directional pulse traveling at the speed of light. If it strikes a target, it is backscattered to the radar, which uses the elapsed time to determine the distance, or range. By rotating the antenna, it samples all azimuths in a full circle from 0 to 360 degrees.
This gives us a complete radar scan that is used to generate a map of all the echoes. Using digital processing, we can also use colors to highlight echoes that produced strong backscatter signals indicating that something denser than empty atmosphere is out there.
This describes how radar sites worked until the early 1990s. But engineers and research meteorologists developed another important technology called volume scanning. Older radar networks only looked at a single antenna elevation, usually half a degree above the horizon.
Instead of sampling the atmosphere on a single geometric plane, why not sample it volumetrically, in three dimensions? Using volume scanning, the antenna does a full sweep, taking about 20 seconds. Then the antenna elevates by about a degree and another sweep is performed. This scan-elevate-scan process is repeated until the antenna can’t point any higher. The maximum elevation for the U.S. WSR-88D radar is 19.5 degrees.
All of these elevation slices or “tilts” form what is called a volume scan.
Depending on the kind of weather taking place, an individual radar site will select the best volume scan strategy, known to forecasters as volume coverage pattern (VCP). The VCP largely determines how many elevations make up a volume scan and how long it takes to finish a volume scan.
This can take anywhere from 4 to 6 minutes in stormy weather and up to 10 minutes in fair weather. Thus, the images you view are not real-time. Add the time it takes to process and transmit the data, and you can see that the image you view can have data that’s 15 minutes old.
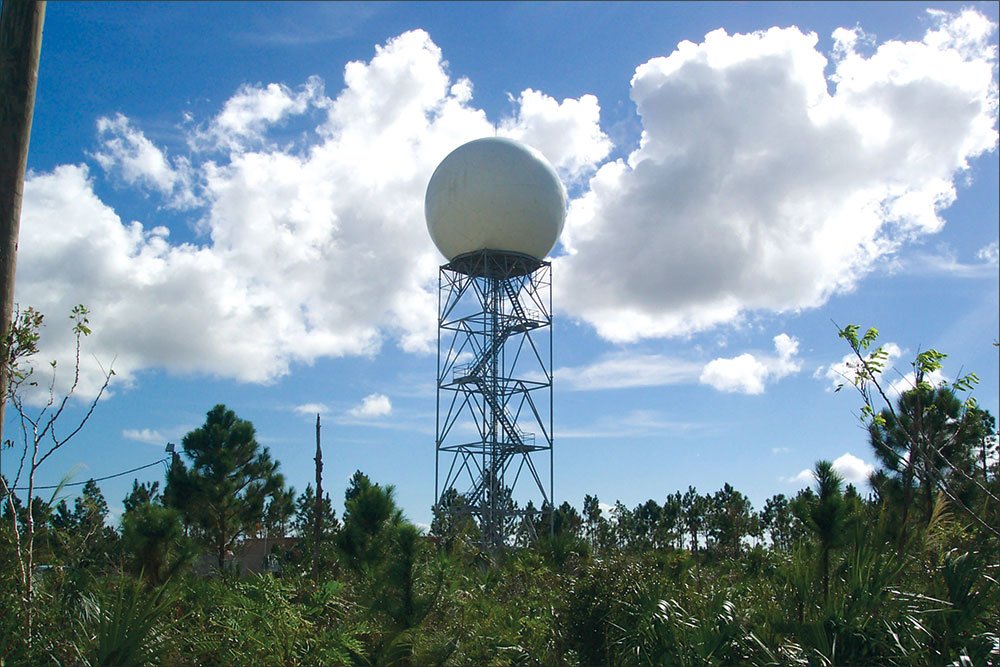
Weather radar from direct-broadcast satellite and Internet sources is built largely from the WSR-88D radar network of 159 sites across the U.S. Keep in mind that this is S-band radar, which operates at a longer wavelength (lower radio frequency) than airborne radars.
S-band radars use large antennas and powerful transmitters to provide excellent penetration through precipitation, minimizing attenuation and shadows. Their underlying images are inherently better than airborne radars that suffer from the restrictions on antenna size.
The classic radar image showing strong and weak echoes is depicting reflectivity. This is a measure of backscattered (reflected) energy from the targets.

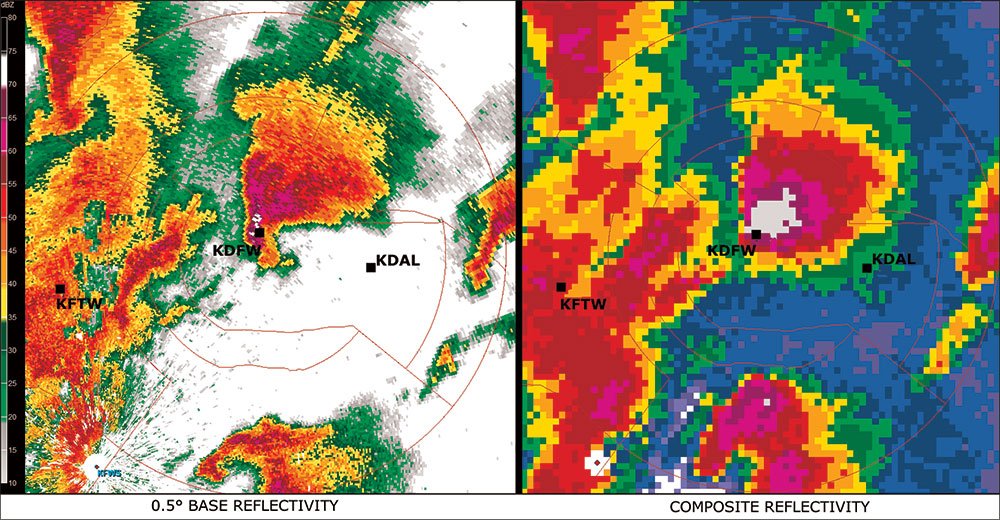
It’s important to note that there are two types of reflectivity products. Base reflectivity is an image from a single elevation tilt. Composite reflectivity is a blend of all the tilts together in the entire volume. At a given spot, the composite-reflectivity value is a measure of the highest reflectivity that was detected at that spot on any of the elevation slices.
Reading the Radar
The best starting point to interpret your display is the type of reflectivity—base or composite. If the menus and labels aren’t clear and the vendor doesn’t specify it, dig until you find out. Base and composite-reflectivity displays are constructed differently and at times they can appear very different.
As a starting point, XMWX and WSI ADS-B show composite reflectivity. By contrast, WSI InFlight uses base reflectivity. Both are excellent products but each has its pros and cons that must be understood to be able to reap the maximum benefit from the information.
Why use two types of reflectivity? Composite reflectivity doesn’t miss anything. If it’s near the ground, it shows up. If it’s near the tropopause, it shows up. So why use anything else? Well, meteorologists need more granularity.
For example, the hook echo signifying a tornado only shows up in the lowest mile or two of the atmosphere. Using only one elevation at that level, it shows up beautifully, but if we use composite reflectivity, that hook echo is merged into all the hail and rain at higher levels and we just see a blob. So forecasters prefer to look at base reflectivity and page between the different elevations, though composite reflectivity helps with the big picture.
You should not be looking for specific shapes and features like hook echoes when assessing things on composite-reflectivity displays. But we do have intensity, which is quite useful even by itself, because the only weather phenomena capable of producing very high intensities are hail, particularly if it’s large and wet, and highly dense volumes of rain. Both of these usually signify a strong storm that should be avoided.
Caveat Emptor
Composite reflectivity does have its downsides. For example, anvils from storms have considerable ice content being carried up to a hundred miles downwind by the jet stream, and these plumes are easily picked up by higher radar tilts. This will cause composite reflectivity to “bloom,” showing much larger downwind depth than exists at most levels. This precipitation might very well be affecting a jet at cruise altitude, but a Bonanza near the ground might see only VMC, a broken layer of anvil overhead, and cumulus buildups to the west.
Another caution comes from winter weather or a cold-rain situation. If it’s just above freezing in the low levels, there will be a melting level at a specific altitude where ice is falling into warmer air and melting, forming a liquid coating around a solid.
This precipitation is highly reflective. On base reflectivity it forms a clear ring of reflectivity at a specific radius around the radar where the beam crosses through that level. The ring radius varies with radar tilt. As a result, composite reflectivity will stack all these different rings together, producing multiple concentric rings around a radar site, with some of these melting level artifacts incorrectly suggesting areas of intense precipitation.
While it’s difficult for anyone but a meteorologist to deconstruct a confusing composite-reflectivity image, being aware of how these effects get into your radar display will help you recognize them when they occur.
Picking your way through storm echoes has long been a familiar game of dodgeball for pilots, but there is danger in doing this because the most intense vertical motions are associated with the updraft. Unfortunately the updraft is actually a relatively dry part of the storm, meaning it is non-reflective to radar. An updraft core is made up mostly of cloud droplets in the lowest 5 to 10 thousand feet, with progressively larger droplets and higher reflectivity as you ascend to the top of the updraft. The danger is that in the strongest storms, this process is shifted to higher elevations, often 20 to 30 thousand feet off the ground, leaving the lower elevations with no reflectivity.
Fortunately, composite-reflectivity products actually offer an advantage in terms of safety, because some of the highest intensities in the storm tend to overlie the updraft. So while a Learjet pilot at only 10,000 feet might glance at a base-reflectivity product or her own on-board weather radar and see an echo-free region where a dangerous updraft is located, a Mooney pilot with composite reflectivity from XMWX will see this area saturated with high intensities and give it wide berth.
Composite reflectivity has an advantage here, but if upper winds are particularly strong, the updraft may be tilted, shifting the upper parts of the storm downwind and lowering the composite reflectivity’s margin of safety. Keeping away from the upwind (usually southwest) side of the storm will help keep you safe when upper winds are strong. That said, the AIM’s advice of staying at least 20 miles away from the storm is sound advice indeed.
Radar Network Shortfalls
The ground-based radar network has a couple of vulnerabilities. One is weather directly over the radar site. Imagine wearing a wide-brimmed hat and not being able to look up. You’d be blind to the storms overhead, though you would be able to see all the rain near the ground at short distances around you.
This is the same sort of problem that affects the WSR-88D radar, which can only tilt upward 19.5 degrees. It forms a volume known as the cone of silence, which cannot be sampled. For all practical purposes, this cone only affects areas within 20 miles of the radar. Within this zone, we’re limited to only seeing the lowest parts of the storm. Even if we’re using composite reflectivity, very intense echoes aloft over the radar site will likely be missed and intensities will show up as being lower than they really are.
A good weather delivery network like WxWorx from Baron (XMWX weather source) compensates for this by using neighboring radars to illuminate each of the cones of silence and fill the gap. This is very effective in radar-dense areas like Illinois, Indiana, Georgia, and Oklahoma. But in radar-sparse places like the northern plains and the Rockies, there may not be a radar site close enough. So if you’re picking your way through weather and are heading directly over a radar site, you may not be getting the full picture.
Some areas are simply too far from a radar site. There are several well-documented areas in the contiguous lower 48 states that are poorly sampled—the four corners area (N.M./Ariz./Utah/Colo.), central Utah, southeast Montana, the high desert and central coast of Oregon, and the Big Bend region of Texas.
Here, the radars are far away or blocked by mountains, and they’ll only sample higher elevations. This means if you’re flying in these areas, you’ll need to use extra caution, particularly in IMC and at lower elevations.
WSI NOWrad uses the 248 nm products to fill in those distant areas, but even with that feature there’s still no technology that will get samples in the lower troposphere so far from the radar.
Of course, if you fly outside the service area of all those great radars, you have the same problem. To a certain extent you can use infrared satellite imagery as a crude substitute, though it’s sensitive to high clouds as well as rain clouds.
Getting the Most
We’ve only considered radar data itself for weather avoidance. Most of the systems on the market offer many other tools that are excellent for keeping you safe, such as lightning detection and storm track information. While a whole new article could be written explaining how to integrate all these tools, a firm understanding of radar basics, a timely and complete weather briefing and good situational awareness are more than enough to keep you safe.
That said, perhaps we can distill this article into a little simple advice. Remain clear of the red areas and of the updraft and downdraft cores. Keep in mind that they aren’t always one and the same.
Tim Vasquez is a professional meteorologist in Norman, Oklahoma. See his website at www.weathergraphics.com.


