
Did you know that GPS performance worldwide is continuously evaluated in great detail, to make sure the system remains safe and reliable for use by everyone? In 1999, the FAA began publishing quarterly Performance Analysis Reports on the basic Standard Positioning Service (SPS) that is provided by GPS. Let’s take a look at some performance information critical to pilots. The latest report covers April 1 to June 30, 2013, and we’ll look at some of that information.
These reports are a product of data collected at WAAS reference stations around the world, with the greatest concentration in Canada, Mexico and the United States, including Alaska, Hawaii and Puerto Rico.
Availability and Accuracy
Note that SPS availability—whether you can get a position fix at all—and accuracy go hand in hand, but are different measurements.
Imagine a cylinder 17 meters in diameter and 37 meters high. If SPS places you within that cylinder 95 percent of the time, then service is deemed available with worst-case accuracy. Average location accuracy shrinks that to a 9 meter by 15 meter cylinder. During the reporting period of April and June of this year, the availability measured by the 28 WAAS stations critical to the U.S. was 100 percent.
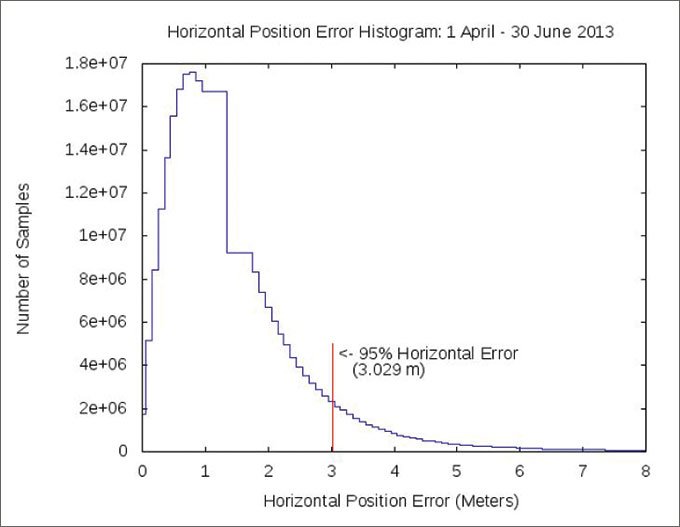
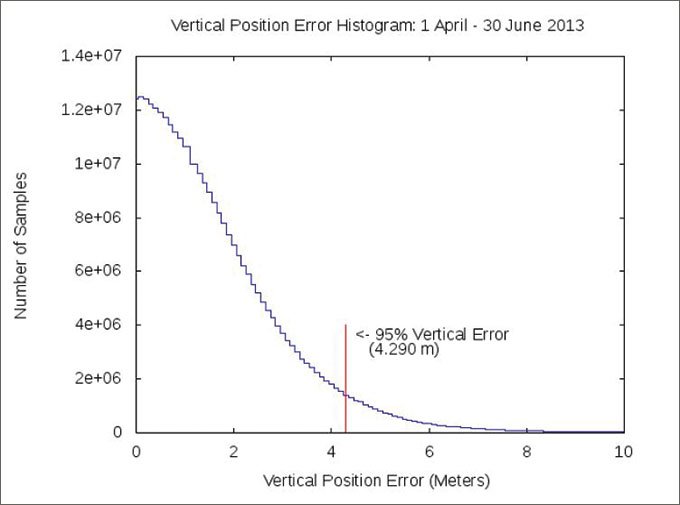
Actual accuracy performance has also been much better than the minimum required, with the largest measured error about 6 meters both horizontally and vertically. The horizontal and vertical position error graphs show that 95 percent of the time, the errors were about four vertical meters and three horizontal meters, even without WAAS.
Accuracy Degradation
GPS accuracy can be degraded by its own nature, Mother Nature and by mankind.
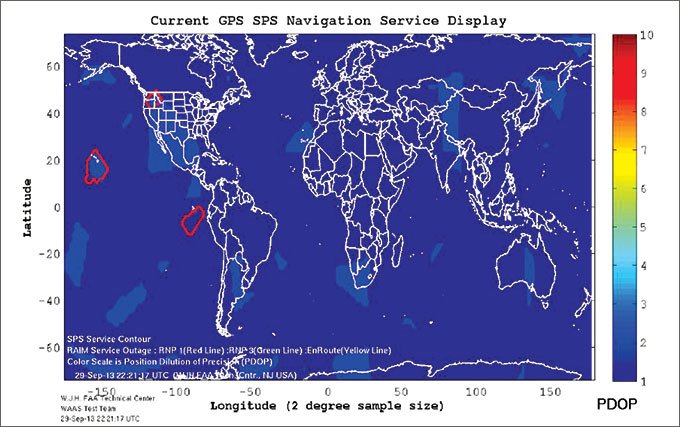
Since SPS uses triangulation from the satellites, when GPS satellites get too close together, accuracy suffers. This is called a position dilution of precision or PDOP. PDOP numbers above six are bad. Called “DOP Holes” they are uncommon, but one occurred off the Florida coast on Jan 23 that lasted 24 hours and had a PDOP of 8.8. SPS came nowhere close to that with a global PDOP of under 3 for the entire April-June period.
As you might expect, PDOP is broken down into horizontal (HDOP) and vertical (VDOP) components. Lower numbers are better. Looking at the GPS SPS display, you‘ll see three red areas depicting RAIM service outages due to poor satellite geometry. The note indicates that within these areas one-mile Required Navigation Performance is not available. Since satellites are always moving, any RAIM contours also move. Accordingly, the page data is updated every three minutes.
Early concerns of not having enough satellites in view are obsolete. The GPS constellation is designed to have five or more satellites in view at all times. There are 24 satellites plus seven spares. You only need five for RAIM and four for WAAS. WAAS availability increased when another satellite was added to the GPS satellite constellation in June.
Outside factors can degrade the relatively weak GPS signals. Other radio signals can swamp a GPS receiver so it can’t detect the relatively weak GPS signals. Or, if a GPS signal bounces off several nearby objects, the multiple signals received by the antenna, called multipath interference, can make it difficult for the receiver to get an accurate position fix.
Direct interference by solar radio burst noise in the GPS frequency range or scattering the GPS signal in the ionosphere both degrade GPS performance. They follow the 11-year solar cycle which is peaking in 2013-2014, but they can occur any time. They only affect reception during daylight hours, so GPS performance during periods of active solar activity remains normal at night.
Magnetic storms can produce strong ionospheric gradients that affect WAAS. Concern over this possibility was great enough for GPS management to implement a program in 2011 to harden WAAS signals against these “iono storms.” Even a solar storm in late June this year had little effect on either SPS or WAAS.
Man-made electromagnetic interference can also jam GPS signals. Unintentional jamming was found to be caused by malfunctioning TV antenna preamplifiers in Moss Landing, CA. Jamming was also behind certain malfunctions at Newark airport. The culprits proved to be truckers driving by who had GPS jammers to block the truck monitoring.
No, No, NANU
In GPS-speak, notification of a satellite reliability, maintainability or availability issue is distributed in a “Notice: Advisory to Navstar Users” or NANU, where Navstar was the military name for GPS. NANUs are the source of the FAA’s GPS NOTAMs.
NANUs are issued for scheduled outages at least 48 hours in advance, but sometimes much earlier. For instance, the shortest notice given between April-June, 2013 was about six days. In the interest of being timely, FAA does not issue GPS NOTAMs until within 72 hours of the event. However, FAA distributes a Flight Advisory of a pending GPS outage or disturbance well in advance of the NOTAM. You can sign up for these notices and more at www.faasafety.gov. Unscheduled outages are reported immediately as you’d expect. Sometimes failing satellites can be predicted, which also triggers a NANU.
During the April-June period there were five outages. Four were maintenance activities lasting a total of 22 hours and were reported in advance while one unscheduled outage lasted 39 minutes. Nevertheless, the GPS system was available 99.97 percent for the period, up a full percent from its cumulative availability of 98.96 percent over the past twelve-plus years.
GPS Test NOTAMs
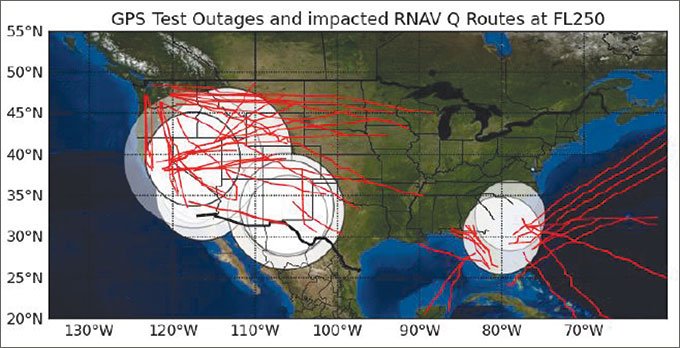
Test NOTAMs are issued when GPS is predicted to be unreliable or out completely at a defined location and time period due to scheduled testing. From April through June, there were 68 such NOTAMs affecting 55 days and 285 cumulative hours with individual durations up to 19.5 hours and averaging 4.2 hours.
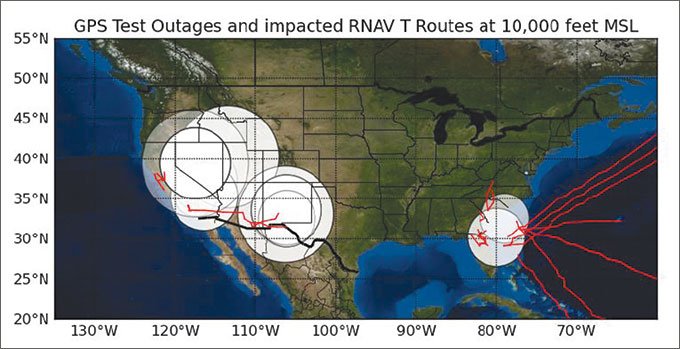
Test NOTAMs most affect aircraft using Q-Routes at high altitudes, around FL 400, but T-Routes 10,000 feet MSL and even down to 50 feet MSL are also disturbed. You can see the effects on the Test Outages charts at FL 250 and 10,000 feet with red lines showing the affected routes. These are available at http://waas.faa.gov/static/sog/notam/index.html.
What’s In Your GPS?
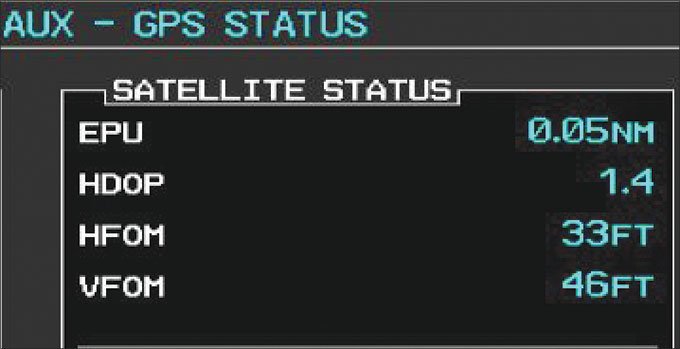
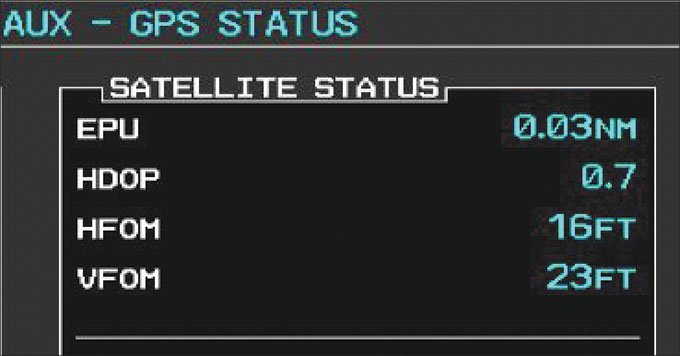
HDOP is shown in Garmin G1000 systems on the AUX-GPS page at a modest 1.4 for basic SPS and twice as good at 0.7 with WAAS. HDOP can range from 0.0 (too good to be true) to 9.9 (awful).
While we’re at it, let’s define those additional acronyms. EPU stands for Estimated Position Uncertainty. The probability of you being actually located within a circle of the radius shown is 95 percent.
HFOM stands for Horizontal Figure of Merit. HFOM is another measure of uncertainty. Here, the G1000 shows a 95 percent certainty that you’re actual position is within the distance shown.
VFOM is the same as HFOM, but in the vertical plane.
Your GPS receiver has horizontal and vertical alarm levels—HALs and VALs—that are different for each approach type. Horizontal and vertical protection levels (HPL and VPL) from WAAS are shown in the Service Level table. How did WAAS perform between April and June? The system easily maintained these limits 99 percent of the time, with a maximum HPL of 20 meters in Miami, FL and VPL of 36 meters in Arcata, Calfornia. In Cold Bay, Alaska, the numbers were slightly worse with HPL at 28 meters and VPL at 37 meters.
RNP 0.1 service is available when HPL is less than 0.1 nm and RNP 0.3 service is available when HPL is less than 0.3 nm. Between April and June, RNP 0.1 was available 100 percent of the time with 99.35 percent service area coverage. For RNP 0.3, both figures were 100 percent.
Close, But Not Perfect
WAAS integrity analysis identifies and evaluates hazardously misleading information, HMI. HMI occurs if the error exceeds either VPL or HPL and 6.2 seconds or more pass before this event is corrected by WAAS. Since WAAS was made publicly available in August 2000 there has not been an HMI event. WAAS was commissioned by the FAA for safety of life services in July 2003.
During the April-June period there were 53 events that affected WAAS performance or the ability to determine WAAS performance during the reporting period. These events include GPS or WAAS anomalies, receiver malfunctions, and receiver maintenance. Many of the events affected Alaska and Canada, and some affected Mexico. Seventeen events were due to high geomagnetic activity and six to radio interference.
During this reporting period, the maximum 95 percent continental U.S. horizontal and vertical LPV approach errors were 1.415 meters and 1.657 meters. The LPV specification calls for 1.5 meters and 2 meters respectively, so WAAS met these parameters.
GPS satellites can have occasional hiccups. The two severity one glitches affected most, but not all, receivers. There were no severity two glitches that would cause all receivers to lose at least one of the two WAAS signals, plus possible other issues. The 19 severity three glitches caused all receivers to lose track of all WAAS signal data momentarily.
WAAS Up?
WAAS airport availability is determined by the number and length of LPV approach outages at selected airports, using WAAS messages originating from the three WAAS geostationary satellites. From these messages WAAS VPL and HPL are computed at each airport every 30 seconds. Once protection levels have been produced at each airport, LPV service evaluation software identifies service outages (i.e. when protection levels exceed alert limits).
WAAS LPV service is available if the vertical protection level (VPL) is less than or equal to the vertical alert limit (VAL) of 50 meters and the horizontal protection level (HPL) is less than or equal to the horizontal alert limit (HAL) of 40 meters. If both conditions are met at a specified airport location, WAAS LPV service is considered available at that airport.
If either is exceeded, then operational service at that location is unavailable and a service outage is recorded along with its duration. The service is not available again until the protection levels are both within alarm limits for at least 15 minutes. Although this reduces pilot availability a bit, it prevents excessive switching in and out of service availability and provides a more predictable and stable service.
Similar service analysis is completed for LP, LNAV/VNAV and LPV 200 services in accordance with HAL and VAL shown in the WAAS Service Levels table. The WAAS LPV 200 Availability map graphically represents LPV 200 availability and outage counts at all airports, including many that do not have published approaches. You can see all these reports online at FAA’s interactive web page http://www.nstb.tc.faa.gov/AirportOutages.
Our confidence in GPS and WAAS is deserved, but we should also verify. You can check RAIM availability at www.raimprediction.net. Check WAAS and GPS NOTAMs at https://pilotweb.nas.faa.gov/PilotWeb. With this done, you may depart with high confidence that whatever GPS approach you may need will be available.
Fred Simonds is a Gold Seal CFII, check airman and factory-certified G1000 instructor. See his web page at www.fredonflying.com.


