Winds aloft charts have long been a staple of flight planning, if at least just to figure wind correction angles and groundspeed. But in Wx Smarts, we try to help you more fully exploit weather products to think more like a forecaster than a person just checking off boxes during preflight.
Even a mundane winds-aloft chart offers tremendous insights, and the principles we’ll lay out here are not only useful, but essential in data-sparse areas like over the ocean. We’ll show you how to get a feel for the chart and get a deeper understanding of the weather patterns at play along your route and how weather systems are organized. The more understanding you have, the safer the flight—every little bit of insight helps.
We’ll be looking at the winds aloft chart for 34,000 feet. Right off the bat you’re probably asking yourself what possible relevance there might be in winds triple your Cherokee’s cruising altitude. Even the single-engine piston crowd, however, can get a ton of useful information from an upper-level winds chart. Weather systems tend to be organized from the top down, and many forecasters will start by looking at winds at the 34,000-foot level (200-300 millibars, actually) to get the big picture.
Back to Basics
Before we get too deep, let’s look at some weather basics. Our number one rule is: Where there’s rising motion, there are likely clouds and precipitation, and where sinking motion is found, you can gamble on lots of VFR. Of course this isn’t an absolute because varying combinations of moisture and stability can affect the atmosphere in different ways. Nonetheless, these rules form a good building block and starting point for our analysis.
Next, consider the tropopause, the boundary between the troposphere and stratosphere. This is a stable layer occurring between 25,000 and 50,000 feet that acts as a “meteorological ceiling.” When an air mass rises, it ascends upward toward the tropopause. The air mass rarely ascends above the tropopause, instead spreading out horizontally, just like the plume of steam from a pot of boiling spaghetti that spreads outward when it rises to the kitchen ceiling.
The weather in the stratosphere is not bound very well to weather in the low levels, so you shouldn’t look at levels that are too high in the atmosphere. The 34,000-foot level is below the tropopause about 99 percent of the time in the United States and gives us a very good top-down view.
Western Trough
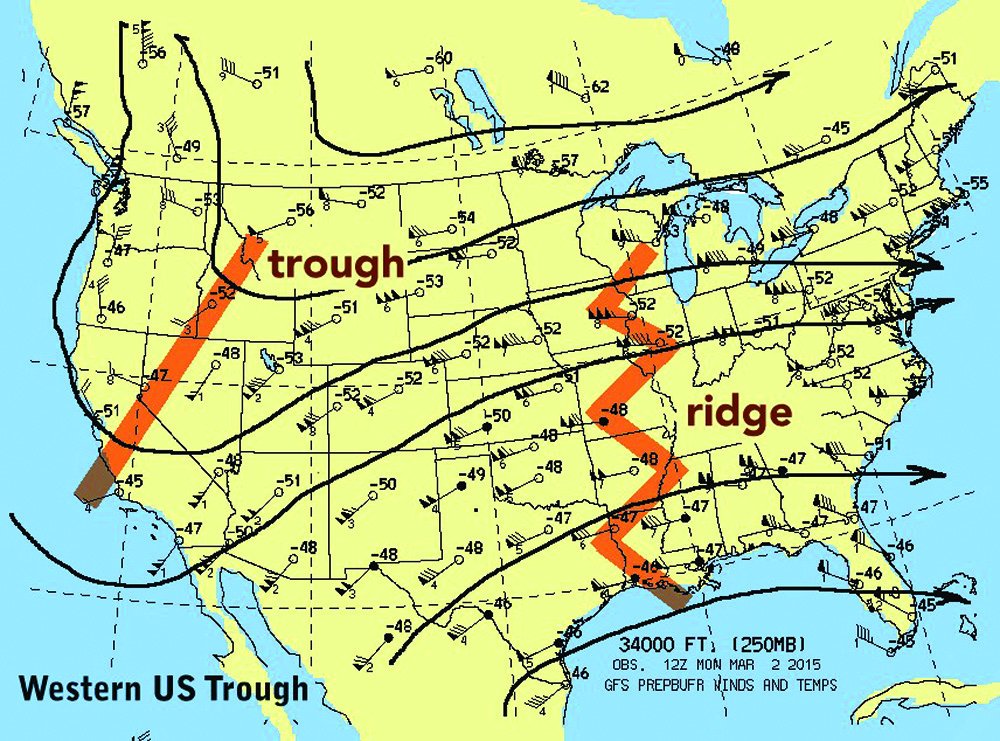
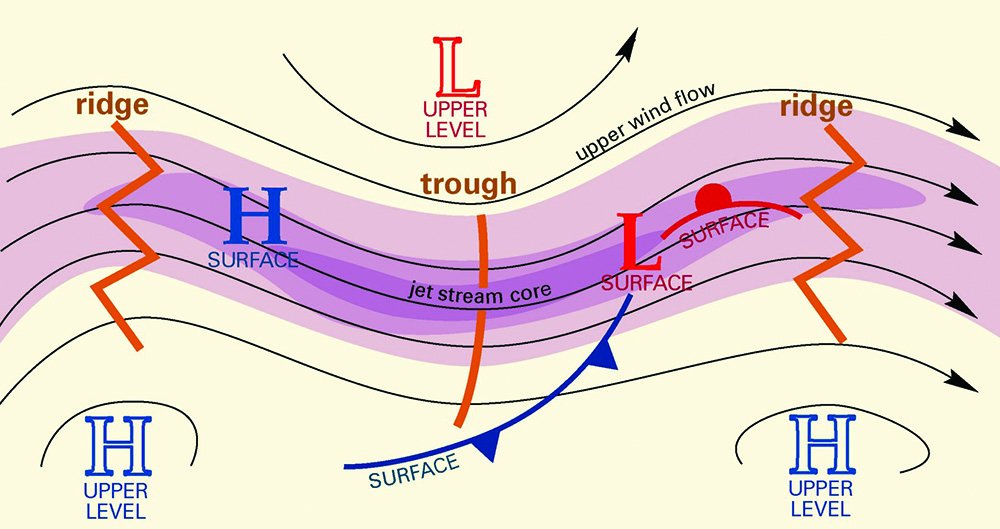
Notice that the wind patterns on upper-level charts form a curvy, wavy pattern. Look at the illustration for the Western US trough on the next page. We’ve drawn streamlines (dark lines) that roughly follow the flight level winds. In this example they illustrate a southward sag over the western states. This is called a “trough.” Indeed, this is similar to a low pressure area aloft.
Over the eastern United States, the streamlines bend northward, as if a big system from the Gulf of Mexico is encroaching and deflecting the wind flow. This is an intrusion of higher pressures aloft that’s called a “ridge.” The figure to the lower left on this page gives you a conceptual idea of the trough and ridge and how they interact.
Upper-level troughs tend to directly overlie large, deep cold air masses. Because of this, we can glance at the chart and correctly guess that weather at Boise, San Francisco, and Portland will be brisk, and the airports will be landing north. Likewise, upper-level ridges overlie large, deep warm air masses. Austin, Memphis, and Atlanta are likely warm for this time of year and airports will be landing south.
The real weather maker is in a very specific spot east of the trough and west of the ridge. In this case, somewhere over the Rocky Mountains. This is where we find the frontal system, with its cold fronts and warm fronts and large areas of clouds, precipitation, and low ceilings and visibilities. How far north or south? It’s found closest to the jet stream—the core of strongest winds.
Also note that we usually find the storm system at the inflection point, where the curvature of the streamlines or contours changes sign, from being influenced by the trough (cyclonic curvature) to being influenced by the ridge (anticyclonic curvature). Thus, we can expect to find the surface system roughly along the Utah-Nevada border. This is much further west from where we initially thought the system was located, but a second glance at the chart shows us that a huge part of the Rockies is actually under the influence of the ridge. My own experience agrees with this. Buckle in if you’ll be landing at Salt Lake City or Las Vegas because those winds over the mountains will create some turbulence.
One trouble spot we often see in this kind of pattern is the broad band of upper-level winds crossing perpendicular to the Rocky Mountains. This means deep, widespread clear-air turbulence through much of Colorado, New Mexico, Wyoming, Utah, and adjacent states. It’s quite deep, too, affecting operations as high as 40,000 feet. Lee-side troughs on the east side of mountain ranges like the Front Range of Colorado put airports under gusty wind conditions with low-level wind shear.
The nastiness out west gives way to good weather in the central and eastern states with a broad, flat ridge covering the region. We can’t rule out areas of low ceilings or showers, since local effects and old boundaries might still produce poor weather, but the general pattern is VMC and very little active weather.
Central Trough
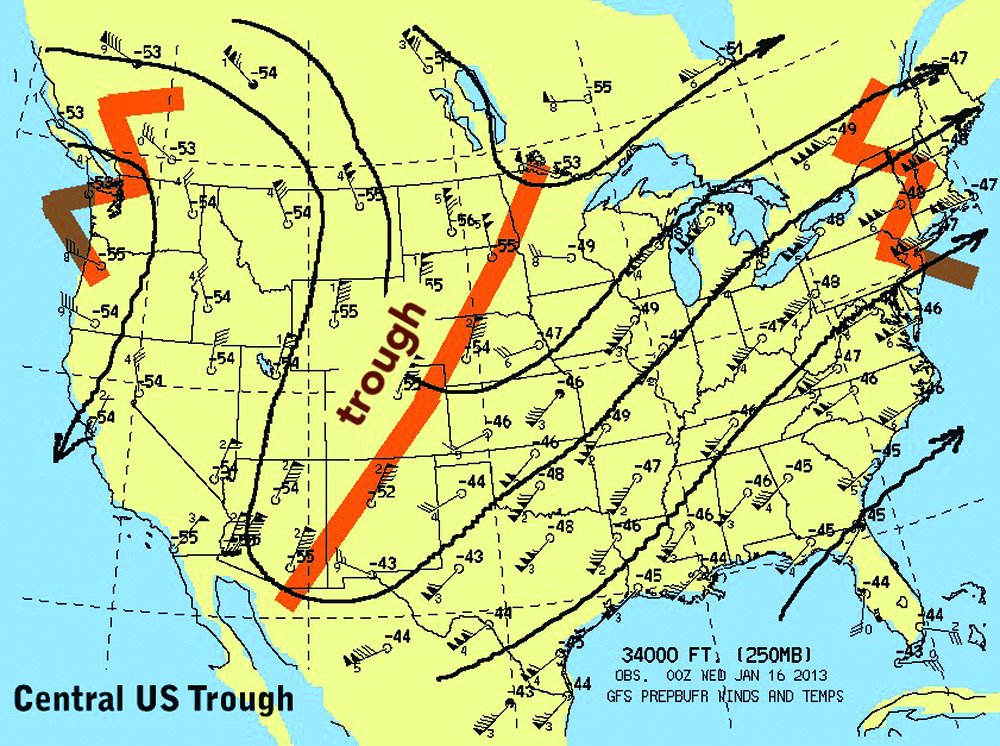
Wintertime upper-level maps often fall into one of three basic patterns for the United States, with an upper-level trough in the west, in the center or the east. The figure on the next page shows a trough in the central U.S. This is usually associated with a weather system moving from the Plains into the Mississippi River valley. The inclement weather at this point has largely shifted out of the Rockies and into the Plains states. Remember the large upper-level trough from the Dakotas to Texas tells us there’s a large, cold air mass over much of the Central Plains states.
These systems often tap a fetch of rich tropical moisture, and this means widespread conditions often develop ahead of the surface systems. You can expect ceilings at terminals like Houston, Austin, Dallas, Shreveport, New Orleans, and Memphis to go below 3000 feet, and almost certainly below 500-1000 feet at night.
The Rocky Mountain region, just behind the trough axis normally experiences VFR. However, a couple of factors help create a strong cold-over-warm air mass situation—modification from below as cold polar air rolls out through the Rocky Mountain region, and advection from above where the coldest parts of this air mass have originated from Canada and the north Pacific. A glance at the AIM’s meteorology section shows us that cold-over-warm is an unstable configuration. With residual moisture behind the departing system, we often see widespread cumuliform clouds and showery weather in the mountains across Wyoming, Colorado, New Mexico, Utah, and Arizona close to the trough axis.
This area of lingering shower activity appears as scattered to broken cumulus and cumulonimbus extending from about 4000 feet up to 20,000 feet AGL, and extensive virga will be present. Fortunately it shows a strong afternoon bias, so if you have to fly through this area, do it as early in the day as possible to avoid problems. Normally this unsettled pattern begins shutting down as the upper-level trough axis moves east and upper-level flow subsides.
Elsewhere in the country, the west and east coasts will often be under good flying weather. An exception to the good weather occurs if cold air has “dammed” against the Appalachian Mountains in Virginia and the Carolinas. These areas are somewhat sheltered in the lee side of the mountains and polar air can be slow to clear out.
If that is the case, low ceilings can hang around for days at a time as warm tropical air attempts to ride over the top of these shallow “cold domes” and condenses into cloud material.
One noteworthy thing about the sample chart showing the central U.S. trough on the next page is the enormous wind speeds. The plots themselves show 215 knots in Quebec and 205 knots in northern Michigan. On this date, the highest groundspeed ever tracked by a Boeing 737 occurred in Ontario, where a WestJet captain photographed 692 knots on his MFD and posted it to the www.groundspeedrecords.com website.
Eastern Trough
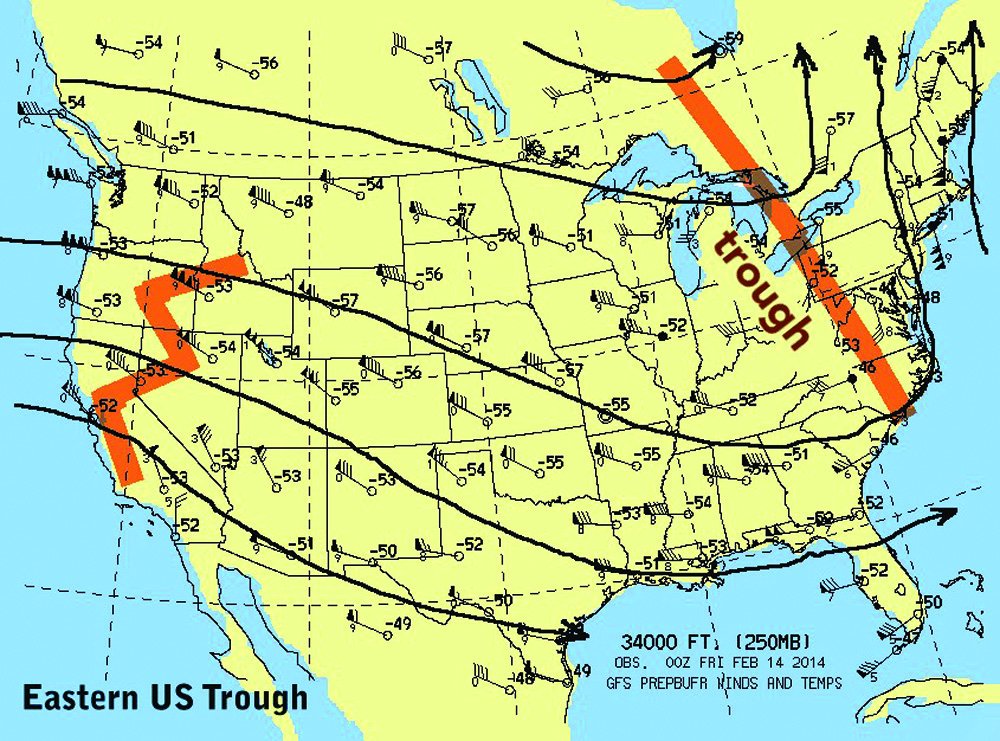
When an upper-level trough covers the eastern United States with a ridge in the western states as shown on the next page, this means bad weather for the northeast states In this sort of pattern, a frontal system can usually be found somewhere along the Atlantic coast. Even worse, these frontal systems will interact with warm Gulf Stream waters, which helps them dramatically intensify. Even if the systems themselves are positioned well off the coast, the cyclonic flow in combination with deepening over the warmer waters can still sling plenty of clouds and precipitation westward into places like Boston, New York, and Washington DC. Things don’t improve until the upper-level trough itself moves past the region.
Eastern trough patterns are especially favored for lake-effect clouds and snows on the Great Lakes. This is mostly an early-winter phenomenon when the lakes are relatively warm and diminishes as the winter goes on. A fresh outbreak of polar air is needed for lake-effect snows to activate, and driven by westerly or northwesterly winds, the American shores are particularly vulnerable at places like Grand Rapids, Marquette, Cleveland, Buffalo, and Rochester. The eastern trough pattern is directly associated with a fresh polar outbreak, so it’s a good idea to be especially vigilant for unexpected IMC conditions when operating in the Great Lakes region.
Meanwhile, the ridge over the western United States brings excellent flying conditions to the western United States. However, problems can develop if the upper-level flow becomes light, such as when a very large ridge or an upper high moves in. This brings stagnation to the weather pattern and often causes cold air to become trapped in valley regions, especially in mountainous terrain. Overnight stratus clouds develop and help radiate even more of the heat away, and it becomes a vicious cycle as these valleys sink into days and even weeks of IMC. Common locations for this type of valley fog include places like Salt Lake City, Boise, Yakima, and even the San Joaquin Valley of California. Only the Desert Southwest region is spared. The fog only ends once there’s a major change in the upper-level weather pattern.
Summing Up
We’ve provided some good basic forecast principles to get you started. With these, when you’re flying in unfamiliar territory or making an ocean crossing, you’ll be able to look at any upper-level wind chart and get a good idea what’s probably going on down below.
Keep in mind that the patterns will sometimes not fit the idealized examples shown here. We see things like this from time to time with split-flow patterns, omega blocks, and cutoff lows. Don’t let these patterns confuse you. Just keep it simple and stick with the basics of what you know, such as the rules of thumb on where to find the surface front. And now you, too, know how to recognize what weather hazards might be in store using just one essential chart.
Tim Vasquez is a professional meteorologist in Palestine, Texas. He offers some extra weather training on his site at www.weathergraphics.com and youtube.com/user/timwxx.