Long the purview of sophisticated flight data recorders available only to airlines, many of the popular integrated TAA systems being installed today can record all the critical—and embarrassing—data about your flight. Activating a data logging feature typically calls for little more than inserting a memory card in a slot; the machine does the rest.

Data logging is available in newer versions of G1000 software, Cirrus Perspective (a type-specific G1000), Avidyne Entegra and R9, Cirrus Tail Remote Data Logger, Arnav ICDS 2000, and Eclipse Avio. Handheld GPSes have also long been able to log and display data as we’ll discuss later. For this article, we’ll discuss the G1000 system.

Turn It On
Data logging in the G1000 and Perspective first appeared around 2009. It’s found on the AUX – Utility page. If you have a field labeled Flight Data Logger, you’re good to go. If that field isn’t there, you’ll need a software update.
Insert an ordinary SD data card in the unused MFD slot. The FMS will find the card and begin logging and the Flight Data Logging status will be Logging Data. If the card is full, you will get the error message, Error Card Full.
In G1000 and Perspective systems, the data is sampled every second. My experience shows that roughly 1.5 MB of data storage is required per operating hour, yielding more than 600 hours from a 1GB SD card, which is tiny by current standards. Data is written in one file per flight, named with a year-month-day format for proper sorting. The data is written in a generic .csv (comma separated values) text format that is readable by any text reader and can be imported into common spreadsheet and database programs.
However, you can get more dynamic and interesting results by creating a free account and uploading your data to www.cirrusreports.com. I find the upload process to be quite intuitive, working flawlessly every time. Don’t be fooled by the web site’s name, though; it will accept uploads from any of the devices noted above. You can even look at flight profiles posted by other pilots.
Your data is presented in multiple ways. You can get a graph and a top-down view of your path of flight. You can also invoke the 3D perspective or the pilot’s perspective, both of which use Google Earth. More on this later.
The late-model Cessna 182 G1000 with WAAS used for this article reported 43 data points from a possible 51. Parameters include everything you would see on a PFD or MFD screen plus extensive engine and GPS data. A complete listing of available data is in the G1000 or Perspective Pilot’s Guide.
Viewing a Flight
One of the things about the data is that it is easy to edit. It starts logging the moment the system boots up and logs continuously until system shutdown. For this illustration I deleted all the taxi and takeoff data to show just the desired instrument approach.
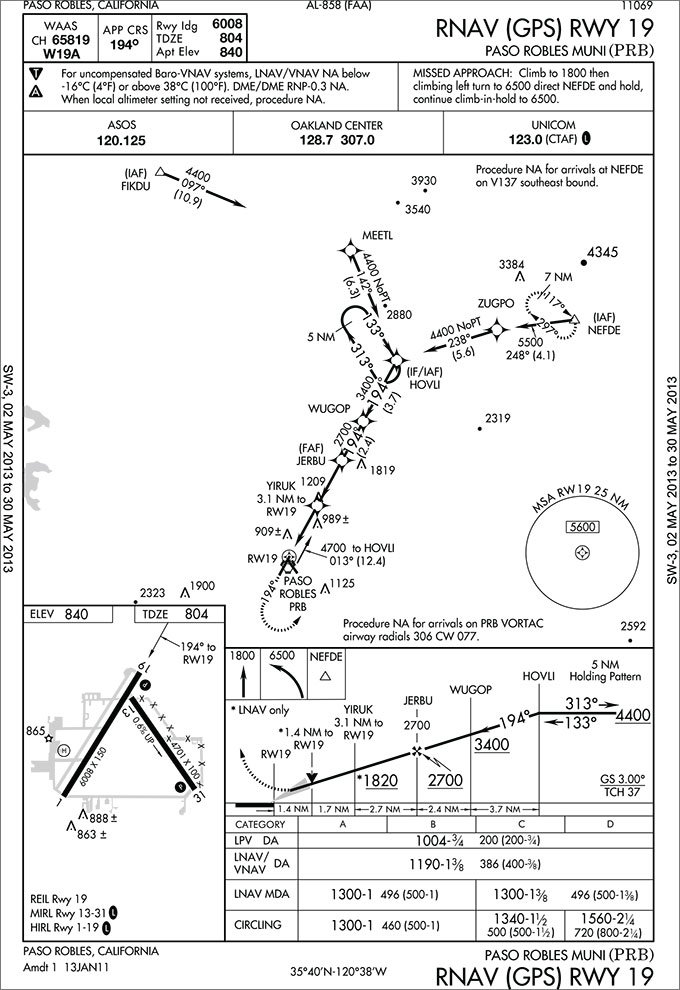
The approach we flew is the RNAV (GPS) RWY 12 at KSUA in Stuart, Florida. We used the LPV with glidepath and it was hand flown by my student.
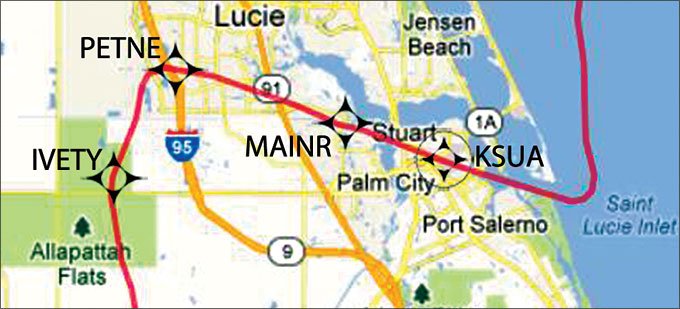
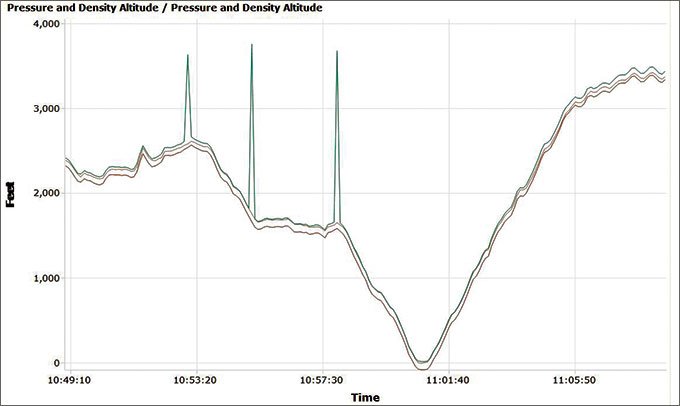
You can see the top-down view of the approach on the map. Similarly, you can see the matching altitude profile on the accompanying graph. Both graphics were generated by the web page after the data file was uploaded.
We pick up the action approaching IVETY. Palm Beach Approach instructed us to cross IVETY at 2500 feet because of the 1549-foot antenna nearby as shown on the chart. You can see IVETY on the altitude chart because I modified the data file to insert sharp spikes to mark IVETY, PETNE and MAINR in the profile. They are also marked on the map. These marks are extremely accurate as the G1000 reports the lat/long values in decimal to seven places.
Approaching IVETY from the far left of the graph, we climbed somewhat erratically from 2400 with a dip to 2100 feet to cross IVETY at 2500 feet as instructed. From IVETY to PETNE the minimum altitude is 2000 feet. You can see that the student busted the minimum 2000 feet at PETNE as he anticipated the descent to the next segment altitude of 1600 feet until MAINR.
We later discussed this error because FAR 91.177 (a) requires us in part to be at or above the minimum altitude on each segment of the approach. This was a great teaching moment because descending prematurely on an approach can be disastrous. The incontrovertible evidence helped drive the point across.
Between PETNE and MAINR the pilot maintained between 1600-1700 feet and crossed MAINR right on at 1624 feet (this from the database, not the graph). From there we were on the glidepath which shows a consistent descent indicative of a stabilized approach to our landing at the bottom of the dip on runway 12. It then shows our climbout from the airport as we contacted ATC requesting another approach to the north.
The accuracy of the data log showed us that we passed IVETY 0.7 nm to the southeast, PETNE 0.8 nm southeast and tagged MAINR almost exactly at 0.3 nm southeast.
Lessons Learned
There are several things to be learned from all this. First, I had always wondered just how accurate GPS altitude is. The GPS geometry for calculating altitude is not very good, but I was pleasantly surprised by how closely it shadows both the pressure and indicated altitude tracks.
The second thing has to do with the usefulness of the data in case of an FAA enforcement action. If a hapless pilot tries to present data log information to FAA as evidence, the FAA will almost certainly reject it on two grounds. First, the data is easy to manipulate as you have seen, and the FAA knows that.
Second, they are more likely to believe their own instruments such as radar tapes because their automation created them. The hard fact is that even if our onboard systems might be more accurate than their radar, it’s their game and their rules. However, if you can show that, say, there was no time to manipulate the database or that it was otherwise not possible, you may have a case.
Accident investigations are a completely different matter. One of the first things investigators will look for is GPS data and use of this data is frequently cited in accident investigation summaries.
More Web Page Goodies
You can see the public files online without an account. Public files such as the one in this article are listed on the home page. Scroll down all the way to the first Cessna Skylane listing. The file number is #18282280. Click to open. Select the parameters you want to see from the drop-down boxes.
On the web page, moving the mouse cursor from left to right on the graph moves the airplane figure along its route of flight and also creates a vertical reference line on the graph. If you place the reference line over a particular graph line, it will show you an exact value and the airplane’s corresponding map location.
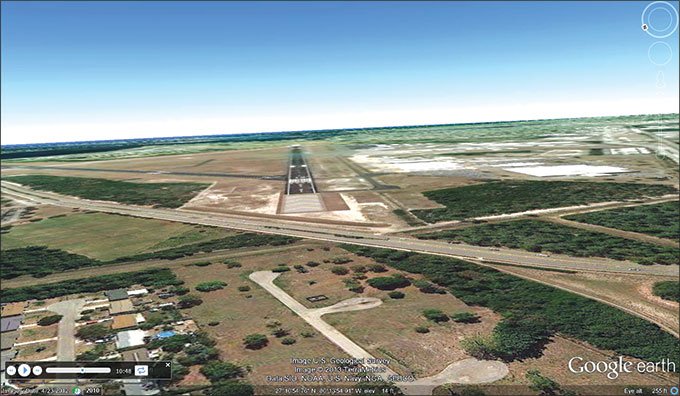
You can show the visual flight track by clicking Cockpit View above the map. This view flies the flight as if you were in the cockpit. It is really dramatic as the photos show. Make sure you have the latest version of Google Earth from http://earth.google.com.
As a Systems Monitor
Another use of the data log is for systems monitoring. The Data Logger has 23 engine parameters that can be grouped into six categories: electrical (4), fuel (3), oil (2), MAP/RPM (2) and a CHT and EGT for each of the six cylinders.
Since the logger samples all the data every second, it can catch transient problems impossible to isolate any other way. Moreover, it can indicate trends, isolate hot and cold cylinders, misfiring plugs, track fuel flow, find electrical issues and probably a lot more capabilities that are limited only by your imagination and systems knowledge. Of particular note may be the CHT and/or EGT temperatures. Average values will be clustered together and any dangerous (costly) outlier will be immediately apparent as the data is graphed.
What? No G1000?
You can still be in the game. If you have a Garmin or Magellan GPS with a USB computer connector, turn it on, make sure it’s receiving satellite signals, and let it run during your flight.
You may need the manufacturer’s software to upload collected data to your computer, but that’s usually included or downloadable for free.
Next, install Google Earth on your computer from http://earth.google.com. Open it and click on Tools, then GPS. Choose the brand of GPS you have. Check that Tracks is checked and click on Import and you’ll see your track in Google Earth.
If you want to see your route three-dimensionally from the top down, Google Earth requires altitude from a .kml file. To convert what you have into .kml, download GPS TrackMaker from www.gpstm.com. Use File/Convert to do the conversion. Then use File/Open on Google Earth to open the file. Right-click on the route, then click Properties, then Altitude. Select Absolute Altitude and check Extend Path to Ground. Once done, you can view the altitude and track of the flight.
Even if you don’t have any of this stuff, many users’ logs are shared on the cirrusreports.com web site and you can watch them freely. Have fun.
Fred Simonds is a Gold Seal CFII, check airman and factory-certified G1000 instructor. See his web page at www.fredonflying.com.