
The one data format pilots are most familiar with is the METAR. You’ve read all about it in training and on pilot forums. In the U.S. they’re driven mostly by ASOS, the Automated Surface Observation System. Unfortunately this is covered a lot less in pilot training. But even in 2019 these systems are not infallible. We’ll go over this technology and help you understand what you need to know to stay safe.
The ASOS system was developed in the late 1980s to relieve the expense of maintaining human observers at hundreds of sites, improve consistency of observations, and bring high-quality observations to rural and remote airports. Much like NEXRAD it was a joint product of the FAA, NWS, and DoD, and was fielded at 1000 US airports between 1991 and 2004. Its main components are temperature, dewpoint, and wind sensors, along with new technology like sky condition, present weather, and visibility sensors.
Temperature
Up until the 1950s, mercury thermometers were widely used by weather services, but they were quickly replaced with solid-state sensors, making it one of the oldest technologies in ASOS. When you read the temperature in a METAR report, you’re looking at a value that comes from a sensor that measures electrical resistance. It’s contained within a shelter in a grassy area of the airport at least five feet above the ground. An aspirating fan helps circulate the air to prevent heat from being gained or lost from the enclosure.
Normally these readings are fairly accurate, but they’re still vulnerable to damage from nesting insects, aspiration fan failure, and even radiated heat from nearby debris and grass fires. Consistency is the rule: if your plans depend on accurate temperature readings, always check the surrounding airports.
Dewpoint
ASOS uses solid-state sensors to measure humidity. Two miniature layers of polymer in close proximity react to the amount of water vapor in the air. The sensor first determines the relative humidity, then uses the temperature to calculate dewpoint.
Installations before the 2000s used the chilled mirror method. This is a system where an automated system literally cools a mirror until condensation forms. That temperature gives us a direct readout of dewpoint. The chilled mirror system is very accurate and is still used today by meteorologists in the Snow White benchmark radiosonde, but the technology has always had a stigma for being high maintenance. This led to it being abandoned in ASOS after a decade and replaced with the more dependable capacitance sensors.
Winds
In the old days, wind equipment was positioned on a 33-foot (10 m) tower near the runway. Observers would watch the dials for two minutes to obtain wind speed and direction. If the lulls and peaks varied by 10 knots or more, a gust would be included. None of that has changed. Wind equipment is still on a 33-foot tower and ASOS takes 24 of its five-second samples to come up with a very similar picture.
Anything with moving parts is a potential source of problems, and that’s true of the ASOS system. Early ASOS equipment used the spinning cups and wind vanes. But these instruments would fail in winter weather. The sensors would literally freeze up and stop moving, resulting in widespread reports of “calm wind” even when gusts were howling out of the north.
Federal agencies worked on the problem and adopted the Vaisala ice-free wind (IFW) sensor, which was deployed starting in summer 2005. It uses transducers mounted on three posts spaced a foot apart that transmit ultrasonic pulses through the air between the posts. It uses the difference in the time of arrival to estimate how fast the air is flowing and where it’s moving.
This sensor defeated the ice problem but introduced a perfect perch for birds. Birds on the sensor block the path, trigger faults, and cause lost data. A lot of missing ASOS wind data in the late 2000s was from birds.
The mast contains an electric heater that’s triggered when something blocks the sample volume, but exceptionally heavy ice can still overwhelm the heater. Fortunately signal processing detects all blockages, and winds are currently reported as missing during ice storms instead of calm.
Another problem is the manufacturer in 2016 announced the discontinuation of the wind sensor and said parts would no longer be available. This left Federal ASOS users in a predicament wherever wind sensors have trouble. A follow-on sensor is currently undergoing testing, but it is more temperamental with more missing wind data. It also yields mixed results in the western United States, so it will be gradually be installed at sites in the north and eastern U.S. until the issues are worked out.
When it works, it works well. However since the wind equipment is not at the runway threshold, it’s often a good idea to ask towered airports for a spot wind check while you’re on final, as many of them can get you a wind sample from the active runway. If in doubt, ask where the sensor is; they’ll know.
Present Weather
When an airport reports fog, rain, or dust, a human identified the precipitation 20 years ago but not today. ASOS detects weather types using a horizontal infrared beam positioned 10 feet above the ground. It illuminates a 1-meter volume and uses advanced signal processing to extract details about anything disrupting the beam. It can determine things like particle size and fall speed. This is then used to classify the condition and estimate what precipitation type might be occurring.
It’s important to remember that this all comes from infrared signatures, and sometimes the instrument is wrong, particularly when winds are gusty or mixed precipitation forms are occurring. Also since the system only examines a 1-meter volume, the sensor knows nothing about weather around the airport. This can be a problem at large airports covering many square miles, and if things don’t look right it’s indeed a good idea to ask approach control or the tower for its take on things.
The system also uses a dedicated freezing rain sensor. A probe sticks upward and tracks its resonant frequencies to detect the accumulation of ice. This is used to report freezing rain (FZRA) and freezing drizzle (FZDZ), which look exactly like rain and drizzle when passing through the present weather sensor beam, but form a glaze after impact.
Visibility
Before the arrival of ASOS in the 1990s, weather observers would walk outside and visually scan the horizon. They would first determine prevailing visibility, the minimum distance that objects can be identified and recognized throughout at least half of the horizon circle surrounding the station. They would then look for any areas of reduced visibility in a specific direction that could affect flight operations.
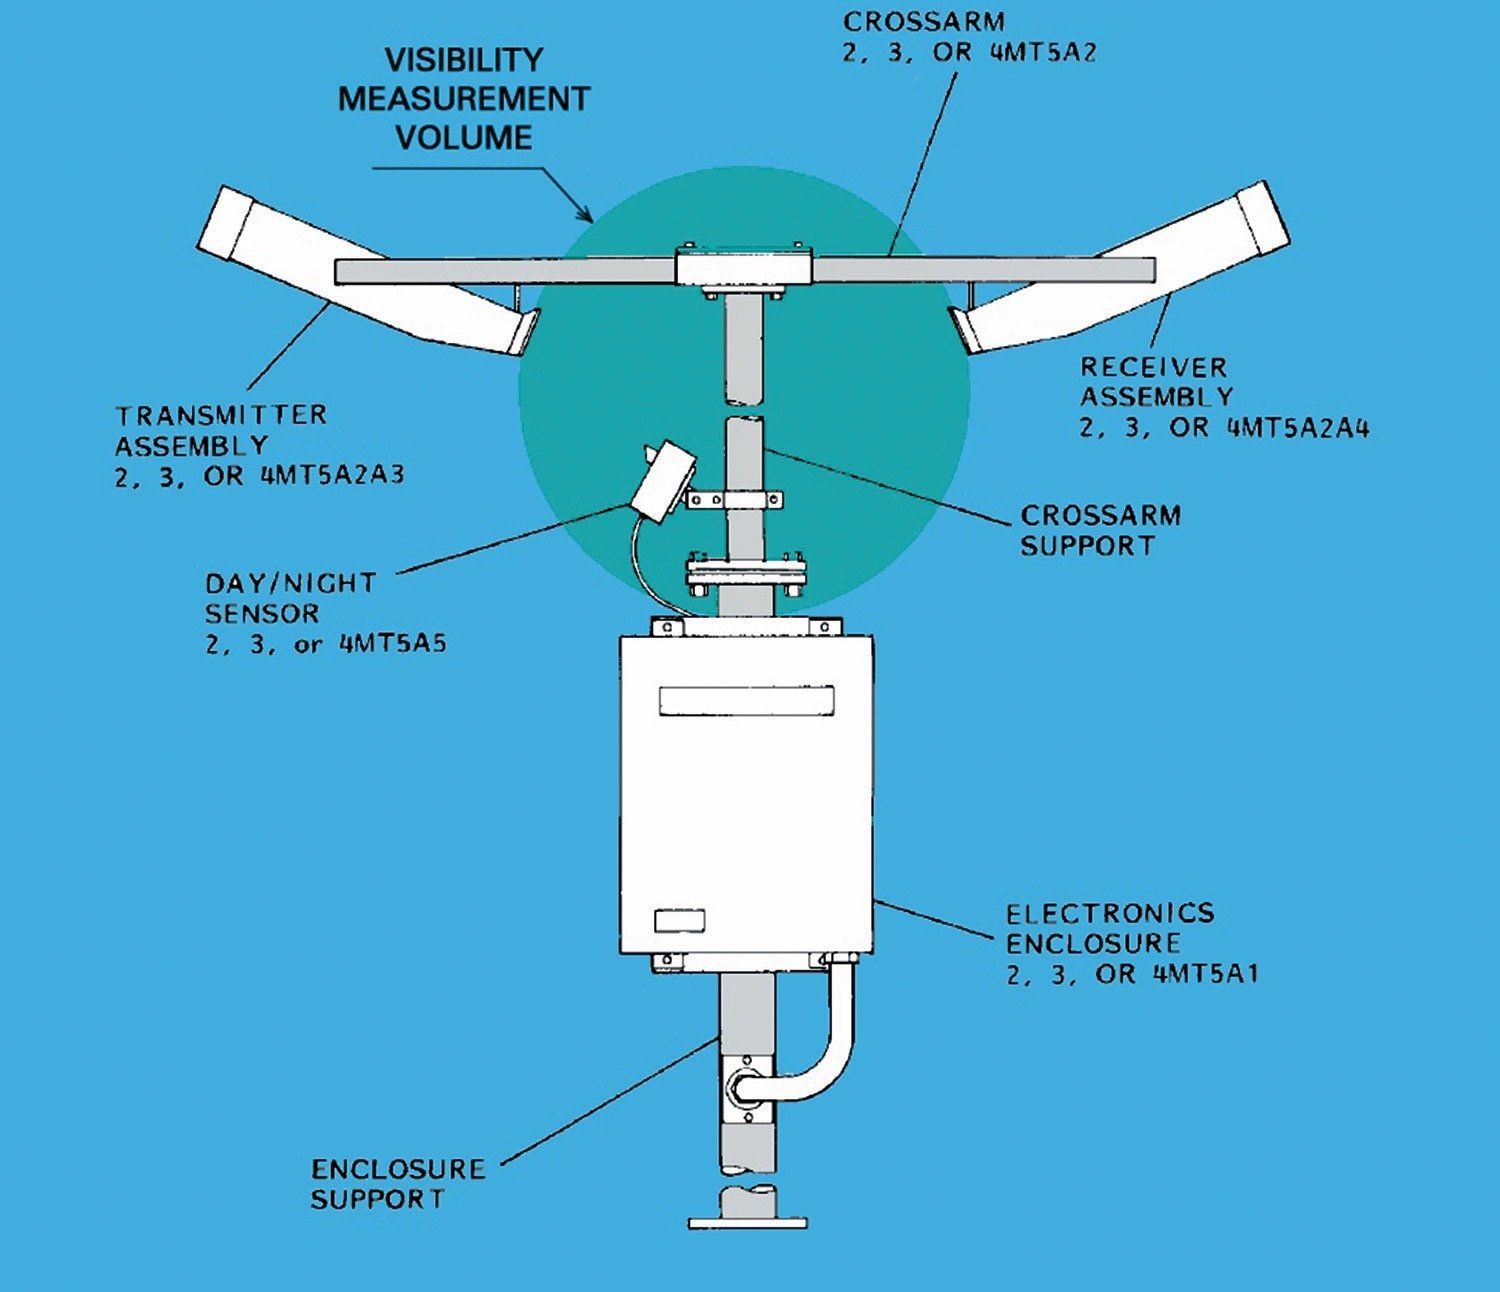
This is still the way it’s done throughout much of the world, where budgets are often limited and automation has made slow inroads. But in the United States—one of the first to embrace automation of weather observations—the way we measure visibility has changed substantially. Instead of scanning the horizon, the ASOS system illuminates a 1-meter volume at the site location, usually near one of the runways at a height of about 10 feet above the ground.
If you’re familiar with driving through fog and having to shut off your high beams so you can see better, you now understand how the ASOS visibility sensor works. The sensor uses a burst of light from a xenon bulb to illuminate the sample volume, and measures how much is scattered back to the sensor. This is closely correlated to the extinction coefficient of the air. If visibility is extremely good, almost no light will be reflected. But if visibility is poor, a lot of light will be scattered from the sample volume, dazzling the sensor, and the ASOS will report a visibility that puts you in IMC.
Ceilometer
In the old days, ceiling height was a particularly difficult problem. Pilot balloons were used by observers as far back as WWII, but the electronics revolution of the 1950s drove federal agencies to develop the rotating beam ceilometer (RBC). It was eventually used at hundreds of U.S. airports. A light beam oscillates from horizon to zenith, and a detector pointing upward tracks variations in the light. An observer peering down into the RBC scope very much resembled Mr. Spock taking readings at his console in the old Star Trek episodes.
By the late 1980s, lasers revolutionized everything by getting rid of the moving parts. With the laser beam ceilometer (LBC) a laser beam is pointed permanently at the zenith. Much like radar, the system measures the time of arrival of bright spots where cloud layers are found.
In days past nearly all stations had a human observer to take the pieces of information from the RBC and sort out which layers corresponded to which clouds. Observers were also highly skilled at estimating cloud heights when no RBC was available. Observations even at the smallest airports contained important cloud forms observed around the station, such as ACSL (altocumulus standing lenticular) or TCU (towering cumulus), and coded cloud types were reported at major stations every three hours. The loss of human observers in the 1990s brought about the loss of most this data, and some of us are still bitter about it. It’s a problem that affects not only pilots and storm forecasters but also climatologists trying to keep track of long term changes.
The LBC systems we have today rely on time averaging to estimate the amount of cloud material. This works on the assumption that clouds are continuously moving over the station in a constant procession. If an hour passes and the system is showing a very persistent layer at 2500 feet, that layer can be assumed to be broken or overcast. But at the same time if winds aloft are calm and there’s no cloud drift, a single cumulus cloud sitting over the airfield will be reported as overcast.
Because time averaging is not very accurate and varies depending on the upper-level winds, cloud amount should be regarded as one of the most vulnerable elements to error. When planning your flight, it’s wise to check sky condition at surrounding stations and crosscheck this with satellite imagery and human-augmented observations at any large regional airports that are nearby.
Large airports like DFW and Atlanta are still augmented by human observers. Here, the sky condition and visibility can be considered as good as it gets. If you fly near those stations, it’s wise to check in on their remarks, as the observer will often report in remarks any storms, precipitation, fog banks, and other phenomena in the distance that are affecting smaller airfields nearby.
Pressure
Finally, we have pressure. The ASOS system uses a solid-state pressure transducer contained in the equipment housing. The sensor yields a directly measured value known as station pressure (QFE), which is the same as what a laboratory mercury barometer would show if it was brought to the airfield. At a place like Denver it would read 24.49 inches or 829 mb.
Since pilots use different reference levels, this has to be converted to be usable. The simplest method is just to subtract out the station elevation using a standard atmosphere. This is relatively simple and gives us altimeter setting, or QNH. ASOS reports this in the METAR observation as “A” followed by the value in inches.
Some stations report sea level pressure (SLP) in millibars in the remarks, or QFF. A pervasive misconception is that this is just QNH converted to millibars. The SLP reading is similar to QNH but factors in 24-hour temperature history, climatological normals, and local terrain to try to remove small-scale atmospheric noise, so that the data is more readily usable in synoptic weather charts. This is not used in U.S. aviation but it’s great for seeing how strong frontal lows and hurricanes are.
What ASOS Can’t Do
Storm-scale phenomena like microbursts and tornadoes cannot be detected by ASOS stations, as there are simply no sensors to report when they’re happening. Likewise, unusual lithometeors and hydrometeors like dust, smoke, falling ash, and sea spray can confuse the present weather sensor or be reported as another precipitation type.
Patchy or shallow fog, especially over the runway, is a particular challenge as visibility is detected only within a 1-meter volume at the ASOS site and not elsewhere around the airfield. If the TAF or your flight weather briefing expects fog on arrival, be prepared for a different picture than the METAR report is showing. This is especially true in calm or light wind conditions, when obscurations to visibility are not uniformly mixed and distributed.
Also clouds above 12,000 feet are not detected reliably or may not be reported at all. It’s quite common for an overcast cirrus layer to be reported as clear. While this won’t have much impact on VFR flight operations, the cloud shadows may make it more difficult to see and be seen, and they’ll cause twilight to catch up with you very quickly. You’ll need to use satellite products, TAFs, and human-augmented sites to get the full picture of what’s happening at all levels in the sky.
Those Arcane Abbreviations
You’ve probably heard that there are two reasons for the abbreviations that are used in all aviation weather products. First is to establish a common “language” that can be understood by any pilot, no matter what his/her native language might be.
The second is to reduce the volume of data being sent over the wires. In this day of gigabit data circuits to our homes, saving space seems steeped in “that’s the way we’ve always done it” and lacks in any purpose today.
Unfortunately, in some parts of the world, the data speeds aren’t measured in gigabits or even megabits, but still in a few kilobits per second.
Hopefully you now have a better idea of where your METAR data is coming from. When the weather goes downhill is when these systems are most likely to fail, so a little extra knowledge just might be the ace card you need when you’ve got the ASOS information on the frequency and you’re descending into a remote airport somewhere in instrument conditions.
Tim Vasquez was one of those guys operating ceilometers and RVR gadgets in the old days. He now he teaches the tricks of the trade from his office in Palestine, Texas.


