
Prognostic charts (“progs”) rank among the most used weather charts in aviation. Progs are published four times a day and provide a comprehensive overview of weather across the United States out to 24 hours. They’re found many places, but the source is the NOAA Aviation Weather Center website under Forecasts > Prog Charts > Low Level. There is also a separate chart set under the “Surface” tab that ranges out to 8 days in the future, but there are no precipitation markings after 48 hours.
Of course, IFR is written for the “accomplished pilot” who often goes beyond the basics. FAA AC 00-45G, Aviation Weather Services Section 8-1 provides a solid foundation on these charts. This gives you the “how” and “what” of reading the chart and understanding what you’re seeing. In Wx Smarts we give you the “why,” and as we’ve said in countless articles over the years, understanding and situational awareness are your ace in the hole when things don’t go according to plan.
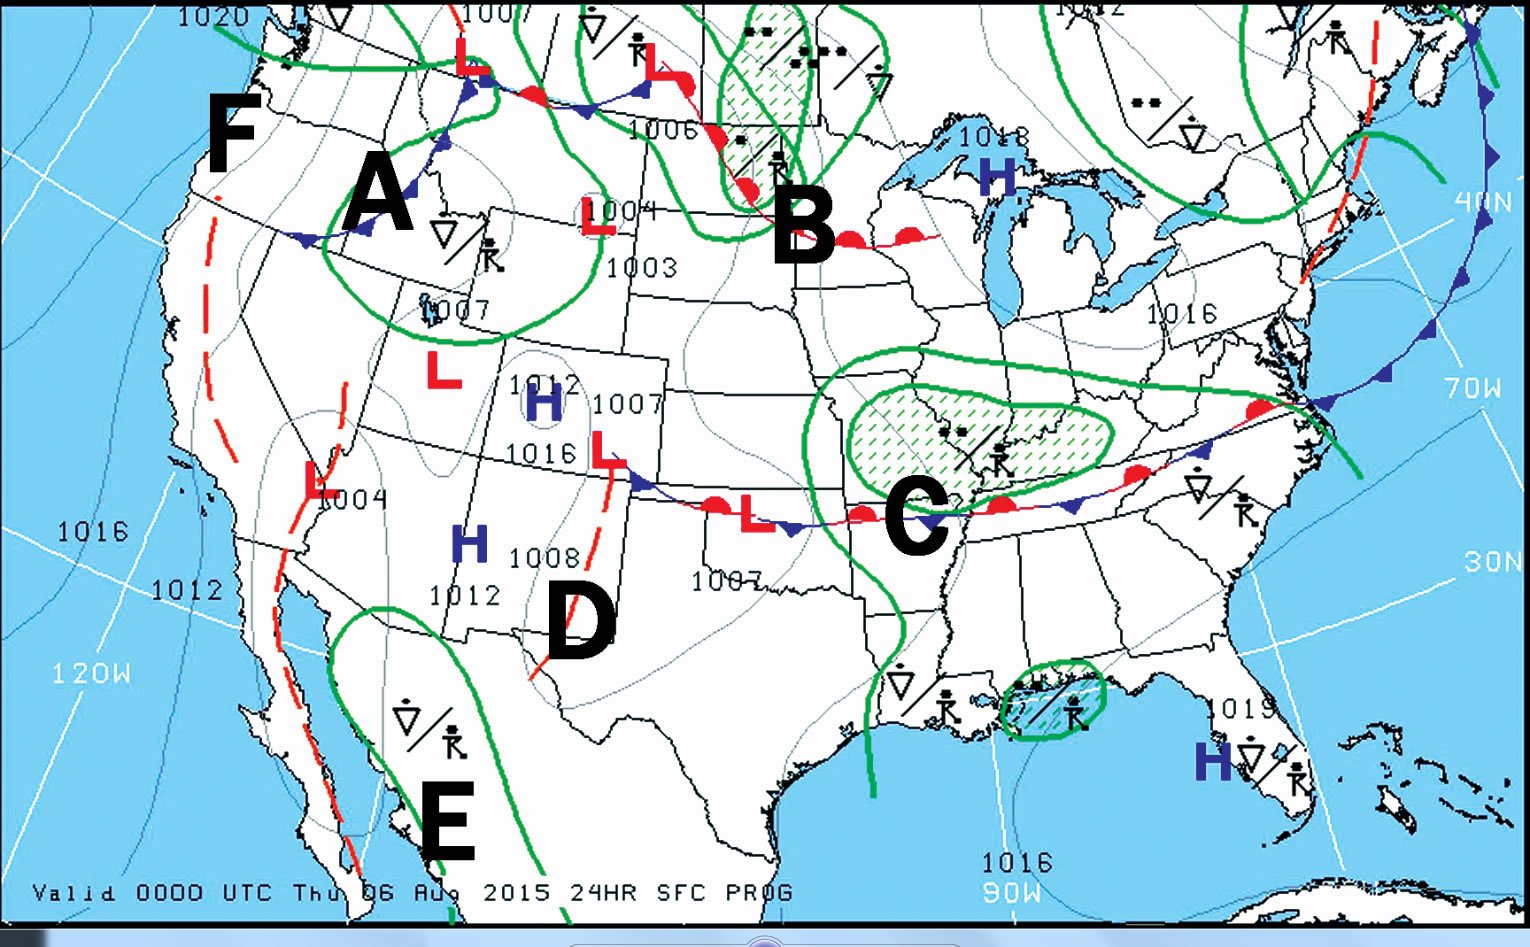
I’ve selected a random late summer chart to review. Let’s go through the weather systems piece by piece and discuss some of the things appearing on this chart that you’ll likely see again.
Cold Fronts
In the Pacific Northwest we find a cold front (A). Its frontal marking is outlined by triangles pointing along the direction of advance. What should you be thinking when you see this? First off, it’s important to avoid two-dimensional thinking, “There’s a front across Idaho I need to watch out for.” Instead, think of the three-dimensional structure. With any front—cold, warm, occluded, or stationary—there is always a cold air mass involved, and the front marks the edge of this cold “blob.” The blob always slopes upward with height toward the cold air.
The surface of this blob, where it contacts the warm air above and in front, is the “frontal surface.” Meteorologists occasionally talk about the slope of this frontal surface in terms of rise/run. In the case of a cold front, a good rule of thumb is that this averages 1:100. In practical terms, this is a 6000-foot rise per 100 nm, but over mountainous terrain, the slope is often steeper, since the lowest layers tend to get tangled up in the terrain while the higher layers sail along unobstructed.
What does the frontal surface mean to you? This contact zone is near the region of strongest lift. Unless you are dealing with a “dry front” you can expect to find broken and overcast cloud layers close to and especially just above this altitude. The area below this frontal surface contains cooler temperatures, and if temperatures are already close to freezing you may be looking at significantly increased icing hazards if you descend through the frontal surface.
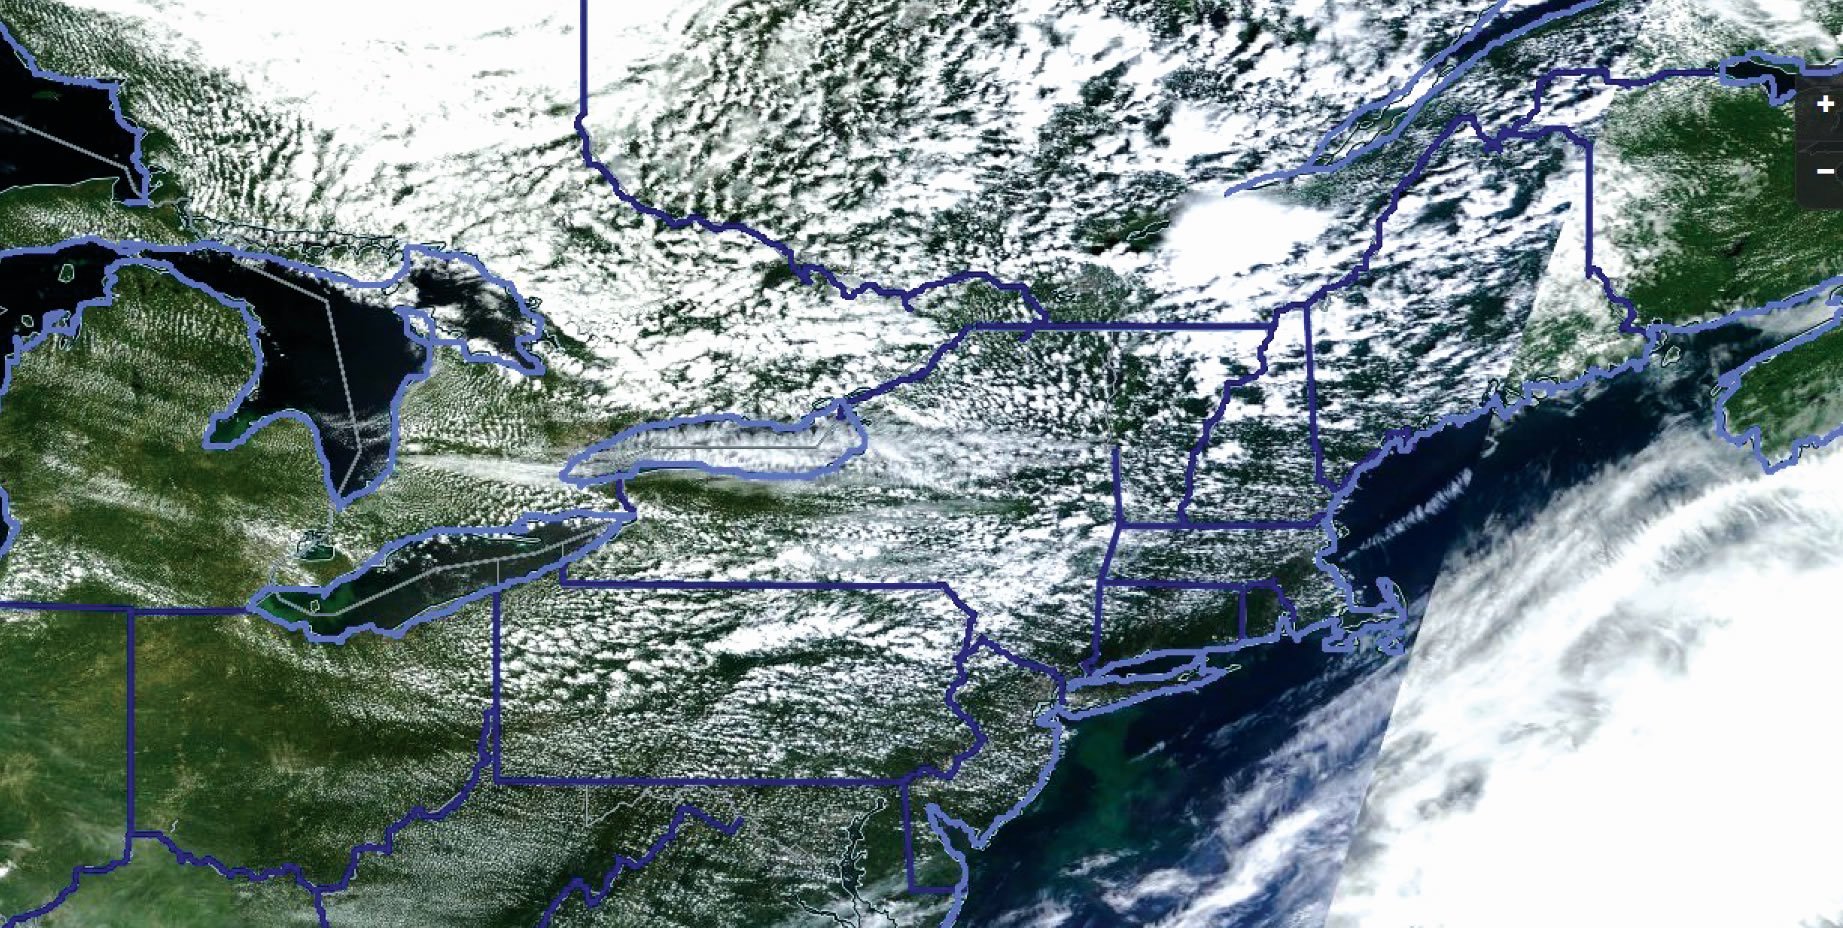
The cold air mass driving the cold front naturally tends toward clear weather, good visibilities, gusty winds and no precipitation, but there are exceptions. One is when there is a combination of a fresh cold-air outbreak and very strong heating. This will cause a strong “cold overlying warm air” situation in the lowest mile of the atmosphere, which translates to strong but shallow instability. Expect plenty of gusty winds, cumuliform cloud layers and possibly showers if enough moisture is present. (See the northeastern states on both illustrations for an example.)
Another example of bad weather behind the cold front is when there is wraparound of the lift trailing a low pressure system. In most cases we see just broken to overcast cloud layers here above 2000 to 5000 feet AGL but in some cases showery precipitation and even heavy snow will reach this area.
Warm Fronts
Across the northern plains, a warm front (B) is bringing a lot of aviation weather problems with it. The warm front is identified by a frontal marking with semicircles pointing into the direction of advance. Remember the cold “blob” we talked about above? It exists here, too. But the frontal slope is something on the order of 1:200, which means that there is only a 3000-foot rise per 100 nm that we travel into the cold air. The air along and just above the frontal surface is typically filled with broken to overcast stratocumulus, altocumulus, and cirriform layers. Below the frontal surface we often find ragged scud clouds below 1000 feet AGL, which may fill into a solid layer if there’s precipitation.
If the temperature of the soil is cold and there is a good fetch of warm tropical air, huge areas of fog will develop as the air mass is chilled by the ground below its dewpoint. These scenarios are usually caught by the TAF forecasts, but you can also spot it on the prog charts when your destination has had a lot of cold weather and there are several isobars trailing southward from the warm front towards the Gulf of Mexico or Atlantic Ocean.
Stationary fronts
The chart shows a long stationary front across the southern states (C), identified by the alternating marks drawn on the front with opposing directions. We call it a stationary front but it’s technically called a quasistationary front because no front is ever truly stationary. Stationary fronts are always on the move, though rarely at more than 5 knots, and may wander back and forth with changes in diurnal heating.
For practical purposes stationary fronts can be treated the same as warm fronts, since they’re structurally similar. In this example you can see an area of rain across Missouri eastward to Kentucky, undoubtedly causing some concern for UPS’s flight operations at their Louisville hub.
Now let’s consider the number one rule of forecasting in the northern hemisphere: air follows all isobars cyclonically (counterclockwise) around lows and anticyclonically (clockwise) around highs. The wind doesn’t flow parallel to the isobars, rather there’s a twist toward low pressure, averaging about 30-40 degrees over land and about 10-20 degrees over the oceans.
Keeping this principle in mind, follow the wind flow upstream from these storms over the middle Mississippi River Valley. The isobars here are gray lines. You will find that there is wind flow originating from the western Gulf of Mexico feeding north to Louisiana and Arkansas. Now compare that with the air feeding the stationary front over Oklahoma. Here, the upstream air originates in eastern Mexico and across San Antonio and Dallas before reaching Oklahoma, implying a lot of travel over dry land surfaces. Now we can see one reason storms are favoring Missouri and not Oklahoma.
Occluded Fronts
An occluded front (not shown) is normally drawn in purple and has the cold and warm front marks on the same side of the line. We’ll save the details for a future article, but note that occluded fronts are a combination of three air masses, not two. This is where a cold front and a warm front have joined up like a zipper displacing the warm tropical air mass aloft. Poor flying weather is typically found on both sides of the occluded front. Unless you’re flying some pretty heavy equipment, it might be better to sit home and binge-watch some Netflix.
Troughs
A trough (D) is better described as a pressure trough, an elongated axis of low pressure. These are drawn as thick dashed lines, which are colored orange on the Aviation Weather Center products but occasionally brown or black on other charts. Any process that removes mass from the column of air above a given point will result in low pressure, except that in a trough it’s more of a linear feature than a focused point.
The most common cause of troughs is from strong surface heating. This is where temperatures are warmest and solar heating is the most intense. The weather is generally good here, with light winds, plenty of VFR conditions, and some light to moderate chop. If there is humidity, such as over the southeast United States or during the summer monsoon over the southwest United States, showers and storms may develop later during the day.
Troughs may also form dynamically where there is strong upper-level divergence. This removes mass from the atmospheric column and induces the development of low pressure at the surface. These troughs are often seen in the Midwest during the winter, west of surface lows, but this chart shows one along the coast of New England. These types of troughs might bring a temporary deterioration of weather and, in their wake, gusty winds.
Finally, lee-side troughing is common east of mountain ranges in all months except the summer. They are quasistationary and occur when strong jet-stream winds are perpendicular to tall mountain ranges. As the air moves eastward across the lower elevations in places like eastern Colorado and western Nebraska, the vertical column of air stretches, resulting in pressure falls. Since lee-side troughing is strongly associated with clear-air turbulence (CAT), it’s always a good idea to sift carefully through the turbulence forecasts and PIREPs in this kind of pattern.
Seasonal Systems
Across northwest Mexico we see a broad area of showers and thunderstorms (E). While your flying might not take you into places like Hermosillo and Culiacan, this pattern is important because it represents the southwest monsoon. It’s the end result of many weeks of strong heating in inland areas, which over time gradually carries great depths of moisture inland.
Though the monsoon’s origins are from Mexico, Texas and the adjoining waters, it often extends well northward along the Rockies into Arizona, New Mexico, Utah and Colorado, especially in the late summer and early fall. Monsoon precipitation favors the 3 P.M.-to-midnight time frame like clockwork, so fly early in the day. If you’re caught out late, beware of broken and overcast middle cloud debris from the storms that may hide mountainous terrain.
Oceanic Highs
It may look like nothing is going on along the Pacific coast, but look a little closer and you can see a pattern of isobars (F). In fact, between central Oregon and the map’s edge, we see a sequence of four isobars, which far exceeds anything elsewhere on the map. You may remember that “packing” of isobars is a telltale indicator of strong wind, and indeed that is the case here, though due to friction from the rough terrain, here it’s probably better characterized as a modest but persistent wind.
Why is this important? Consider what lies offshore: cold ocean currents. These can be important sources of stratus and fog, particularly in the summer and fall, and the persistent northwesterly winds drive the low ceilings and low visibilities onto the Pacific coast and occasionally inland through bays, river valleys, and mountain passes.
Other Markings
The chart shows a lot of four-digit numbers, such as 1003, 1006, and 1016. These are pressure readings in whole millibars (hectopascals). Clearly, these are not granular enough to use to determine the altimeter setting at a given airfield, but are useful as we’ve discussed to determine winds and air flow. You can convert these to the familiar inches of mercury by dividing by 33.8636 to get an approximation that overlooks local influences.
Finally, the prog charts have precipitation markings. There’s a reference table in FAA AC 00-45G Section 8-1. These are important because the precipitation categories are carefully selected by the aviation forecaster. Consider the precipitation types which are associated with an unstable air mass: showers and thunderstorms, which by definition fall from cumuliform clouds. On the other hand, rain, snow, drizzle and freezing drizzle are considered to fall from stratiform clouds and are associated with a stable air mass.
How are these two kinds of air masses different? In an unstable air mass (showers and thunderstorms), there tends to be deep mixing of the air mass, and this is effective at dispersing obstructions to visibility but that mixing is also light to moderate turbulence. Gusty winds may be observed, especially in the afternoon. So, seeing the shower and thunderstorm plots means you will be dealing with this unstable type of weather regime.
Likewise when you see the stable precipitation forms (rain, snow, drizzle and freezing drizzle), this means your air mass will be stable and you should be on the lookout for reduced visibility like haze and fog, which are likely to worsen as things develop. It also signifies that precipitation is developing from broad-scale lift and that low- and middle-cloud layers reported by TAFs and area forecasts are likely to form a solid overcast. A mixture of stable and unstable symbols, as we see here on the Gulf Coast and Missouri-Kentucky area, means that some of the hazards from both stable and unstable air masses can be expected to exist.
Outlook
In upcoming articles we’ll take a look at some of the other Aviation Weather Center charts in more detail and hopefully get you on your way to seeing all of the charts like a master forecaster. While your job is not to replace a qualified weather briefing, you’ll be in a better position to put your briefings together alongside the Internet charts and products like XM Weather to minimize the chance of any surprises as you fly.


