
Before EFBs and apps displaying electronic terminal and en-route charts, we went through a monthly update ritual with paper charts. Every 28 days Jeppesen chart subscribers got new and updated paper sheets. The new sheets had to be placed into the famous Jeppesen seven-ring binders. Then obsolete charts were discarded. Depending on the subscription coverage, the update process could be quite lengthy. Then we had a yearly checklist to confirm each individual sheet was the right one. Government chart users had it much easier, simply disposing of obsolete chart book(s) and replacing them with new one(s).
For most of us using electronic charts, updating means downloading all the charts, not just changes. For extensive coverage, this can be an overnight affair given the size of the files and download speed. Panelmount navigators have a similar ordeal: monthly downloads of the charts (and other databases) usually onto an SD card and uploaded into the unit.
Let’s dig deeper into how those changes show on the charts and see what some of those changes might tell us.
It’s a Date
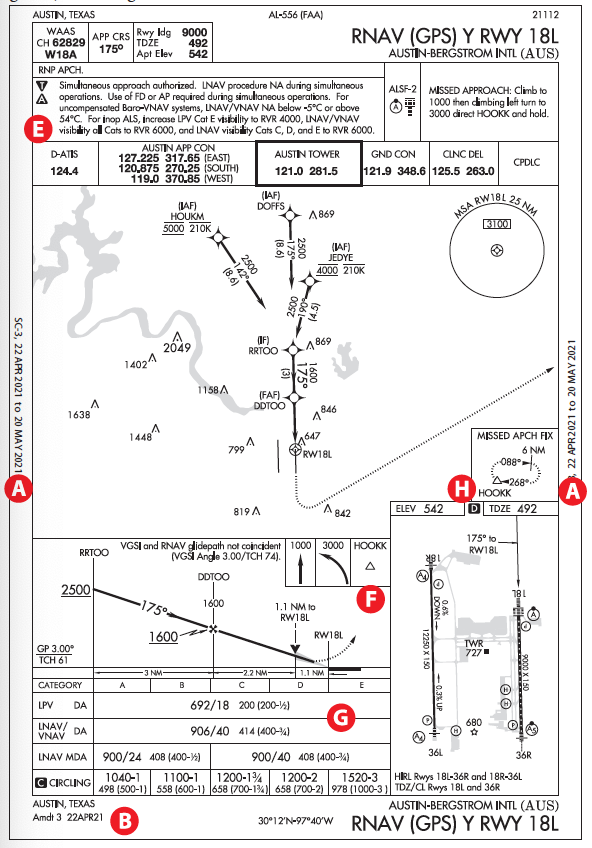
Relatively few terminal charts change from month-to-month. But how do we know if revisions were made? Let’s start with government charts, now from Aeronautical Information Services, AIS. There are two dates. The first is printed vertically on both edges of the chart (A), reflecting the 28-day update cycle. “22 APR 2021 to 20 MAY 2021” means that the chart was current during that cycle.
Clearly when flying, you want to have the current chart, yet that isn’t the most critical date. A more important date is found on the bottom-left corner that states the amendment reference number (Amdt) and effective date (B) (e.g. Amdt 3 22APR21). The amendment date reflects when the chart was last revised. If the date happens to be right before the current cycle, that simply means that there was a recent revision. However, it does not say what changed; it could have been a minor change like a frequency change or a more important change such as missed approach instructions.
On Jeppesen charts, the issue date (or date when last updated) is written at the top of the chart. At times it might also have an effective date in inverse print, if different from the issue date. On the lower left side, printed vertically, it states the amendment number along with the date, similar to the AIS charts. However, an advantage of Jepp charts is that on the bottom left-hand corner of the chart, the reason(s) for the changes are usually stated. Since AIS charts don’t have information about what changed it is difficult to compare old vs. new.
Since few of us use paper charts the old-vs.-new comparison of AIS charts is a challenge, although printing them might help. But, on the FAA’s web site, when you find a chart (Air Traffic → Flight Information → Aeronautical Information Services → Digital Products → Terminal Procedures and Airport Diagrams) the far right column has a link that allows you to compare recently updated charts.
Runway Number Change
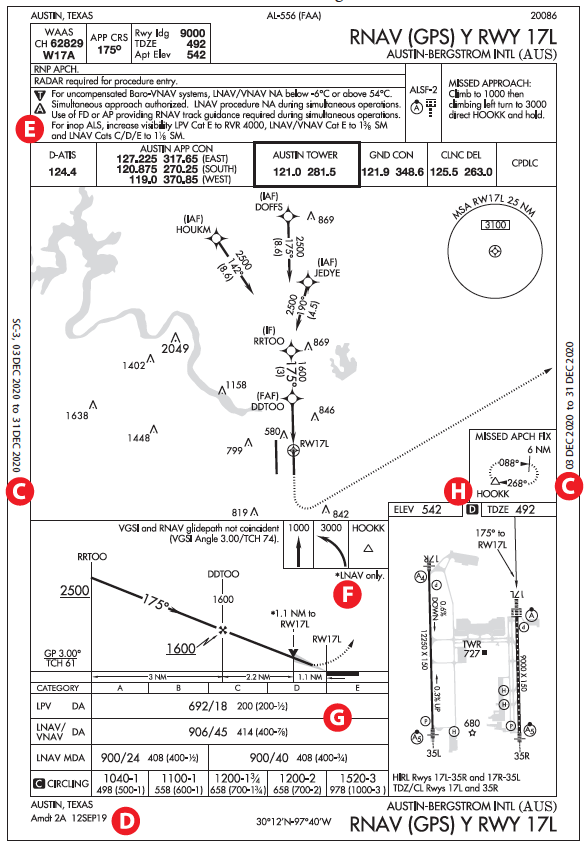
Due to changes in local magnetic variation, it was time to change the runway numbers at Austin-Bergstrom International (KAUS) Airport in Austin, TX. Let’s only consider the RNAV (GPS) Y RWY 17L and the updated RNAV (GPS) Y RWY 18L. Runway renumbering is an obvious change that required a new chart. But when did the change happen? Looking at the 17L chart, there are two dates: the one on the sides and the one on the lower-left corner. The date on the side allows us to confirm that we have the current chart. For example, if we were flying on Dec 10, 2020, the chart would have been current because of the cycle window: 03 DEC 2020 to 31 DEC 2020. (C) On the other hand, if we’re wanting to know the date of the last change, the answer is in the lower left: 12SEP19 and it is referred to as Amdt 2A. (D) In December 2020, the last change was made about sixteen months ago. However, we are still left wondering what changed on Sep 12, 2019.
Fast forward to the spring of 2021, specifically 22 APR 2021 to 20 MAY 2021: That runway number was changed to 18. The change in the approach charts is reflected in 22APR21 Amdt 3. By the way, when runway numbers change, obviously it needs to be reflected on the paint near the runway threshold. Repainting the runway numbers is not a trivial logistical affair since not only are runways temporarily out of service during the painting process, but all the signs that reflect runway numbers must also be changed.
Even with the runway number change, all the magnetic courses remain the same from the IAF to the holding fix.
Other Changes
For a number of reasons, I happened to have both charts in PDF format, so I decided to look for other changes since a side-by-side comparison was possible. See the table (E) (next page) listing changes to the notes.
Additionally, in the profile view of the RWY 18L approach, the annotation “LNAV only” (F) for the VDP (visual descent point) was eliminated. VDPs are only associated with non-precision approaches so the annotation is redundant.
Since the airport has RVR (runway visual range) capability, RVR values— when available—take precedence for a particular runway over reported airport visibilities (in statute miles). The changes reflect that the controlling factor in approach minimums is RVR and not visibility. (G) Additionally, a couple of years ago, the table that converts visibilities to RVR was updated and expanded with additional values. It is in the TERMS/LANDING MINIMA DATA in the U.S. Terminal Procedures Publication, a/k/a terminal chart book. In the regs, the table in Åò91.175 (h) and in AIM 5-4-20.a. is still the old table; apparently to update it in the regulations would require a rule-making process. The AIM table is a subset of the enhanced table.
Our best guess is that changes, other than the change in runway numbers, are minor and perhaps were held off until a bigger change came along like the runway number. I did confirm with the airport manager that the runway number change officially happened at the beginning of April 2021.
“D” on Airport Diagram
Not a common annotation at smaller general aviation airports; “D” indicates that Runway Declared Distances (RDD) are available. (H) RDD is more appropriate for airplane operations that require calculating take-off and landing weights and required runway distances. This would include calculation of balanced-field distances required for take-off. The requirement for RDD could be by aircraft owner policy or requirements in the regs, such as Part 121. Details are in ICAO Annex 14.
But first some definitions:
Stopway (SWY) is a defined rectangular area on the ground that an airplane can be stopped during an aborted take-off.
Clearway (CWY) is a defined rectangular area over ground or water that an airplane can use to make a portion of the initial climb to a specified altitude. It could also include a stopway.
Displaced Threshold (DT) can be used for take-off, and also roll-out from the opposite runway but cannot be used for landing.
There are four distances:
LDA (Landing Distance Available) is the length of the runway available for ground run during the landing. This is what we typically consider as “runway length.”
TORA (Take-off Run Available) includes the displaced threshold distance and LDA.
ASDA (Accelerate Stop Distance Available) includes the DT, LDA, and Stopway; or TORA and Stopway.
TODA (Take-off Distance Available) includes the DT, LDA, and clearway. (The clearway could include the stopway.)
The RDD values are runway specific and are found in the Chart Supplement under the specific airport information. In the case of KAUS, all four values are the same for RWY 18L: 9000 feet. Jepp has the information in the Airport Information pages. It could also include landing distance beyond Glide Slope interception (usually the aiming point marking). Landing and Hold Short Operations (LAHSO) distance, when applicable, are found in the Chart Supplement and in the Jepp airport information.
Other Interesting items
This approach has CAT E mins that apply to approach speeds of 166 knots or more. They are only assigned to certain military aircraft and are usually associated with long runways. In talking to former USAF pilots, even if the speed is less than 166 KTS, CAT E mins are used to provide more conservative values. But at KAUS the mins for LPV for all categories are the same. Also, the GPS missed approach hold at HOOKK has the outbound leg at six miles compared to the more common four, perhaps to accommodate faster aircraft.
The advantage of downloaded charts is that it’s easier to make sure we have the latest charts; however, we still have to check NOTAMS. Typically, we might not care what and when changes were made to an approach because we brief the approach using the current chart. The problem is we might not spot the changes to approaches that we fly all the time because we’ve memorized pertinent data. The safest thing to minimize complacency is to treat all approaches, including the familiar ones, as if they have changes and brief as if you are new to them.


I think the inserted diagrams are out of sync with the text in this article. The second diagram looks like what is being referenced early in the article, and the Jepp chart is missing.
3/1/2023
I agree with Stephen Lop. I am surprised that the author has not responded to Lop’s reply.