
Whether you’re in meteorology school or ground school, the tornado undoubtedly captures the attention. I’ve often noticed how a room goes silent when a conversation about this topic begins. Popular weather articles describe the tornado in terms of collisions between the air masses, jet streams, and fronts, and then go on to describe how to take shelter.
However in this article we’ll give you an explanation that’s more grounded in aviation meteorology. In the airplane there’s no place to hide, so you might as well have the best information at hand so you can make sense of these phenomena when they spring up. I would recommend checking back with our March 2022 article on severe storms for some good starter material.
A Quick History
Surprisingly during the early days of aviation, the U.S. Weather Bureau refused to forecast severe storms and tornadoes due to a pervasive fear that missing a deadly tornado outbreak would be a career ender (for the directors, naturally). There was a similar sentiment when it came to the responsibility of keeping airplanes safe. Because of this, it was a dangerous time for flying, with pilots left to their own devices. The earliest airlines dealt with endless weather-related crashes, prompting them to create their own company meteorology departments in the years leading up to WWII.
By the late 1940s the U.S. military, now confident that all problems could be solved through technology and innovation, began using radar and its telecommunications networks to the fullest. It was Capt. Robert C. Miller who made the first successful tornado forecast in 1948 at Tinker AFB, Oklahoma. It was fortunate timing that the Weather Bureau was now being led by Francis Reichelderfer, a visionary and meteorologist at heart who took notice and helped develop an early prototype of the Storm Prediction Center in Kansas City in 1952.
This agency, called the Severe Local Storm Unit, made great strides in forecasting tornadoes and supercells. The agency took a special interest in the needs of pilots starting in 1957, and began issuing aviation forecasts for severe weather. A dedicated aviation weather department was added in 1982, and became the Aviation Weather Center in 1995. Their website at aviationweather.gov is an important stop for any serious flight planning, and as an aside, they have a great METAR data mapper.
Forecasting
By the 1960s, it had become recognized that severe storms depend on several things: instability, moisture, a trigger, and some sort of shear. This became known as the ingredients-based method of storm forecasting. Our March article covered some of these ingredients in detail.
Captain Miller, who made the first tornado forecasts, again distinguished himself by developing the Severe Weather Threat (SWEAT) Index in the mid-1960s. It was the first index intended to predict tornadic storms. The index wasn’t widely used after the 1970s because it used a simplified model of important ingredients, and as a result it didn’t have great skill. But it was an early forerunner of the Supercell Composite Index that became popular in the 2010s and, though simple, is heavily rooted in the underlying storm processes.
The 1970s and 1980s were a golden age of storm research, and combined computer modeling, field research (i.e. university storm chasers), new radar technologies, and the emerging field of mesoscale meteorology. A vast amount of groundwork was developed during this time that forms the backbone of modern storm forecasting. A detailed model of supercells and tornadic storms emerged. This work emphasized the importance of shear, at the same time reducing the focus on instability.
Wind Shear
We covered a bit about shear in the March 2022 article on storms. In short, to get tornadic storms we need strong directional shear with moderate or strong wind velocities in the lowest one to two kilometers of the atmosphere. This layer is called the inflow layer, and is the layer ingested by the storm updraft. If this kind of shear is present, the layer is said to have strong helicity. Whether this helicity can be converted to rotation in the storm depends a lot on storm movement.
Storms moving significantly to one side of the mean steering flow (preferably to the right, i.e. eastward, southeastward, or southward) are called deviant movers and they’re especially good at converting this helicity to rotation. The Jarrell, Texas tornado in May 1997 was an especially notorious deviant mover, as it moved southwestward, producing an F5 tornado, and it almost reached the Austin area.
Since the 1990s, forecasters have used a quantity called storm-relative helicity (SRH). It compares helicity to expected storm motion. The resulting SRH value is one of the best indicators we have for rotating storms. SRH values of over 150 in the one-kilometer layer are considered excellent for tornadoes.
The Mesocyclone
These forecasting methods tell us the possibility of a storm developing a mesocyclone, often called a “meso.” This is the name for a circulation embedded inside the cumulonimbus cloud, centered on the updraft. The mesocyclone has a diameter of several miles and lives in the middle of the storm, and is strongest at about 10 to 15,000 feet. Visually it can’t be seen, though it can give the entire bulk of a storm the appearance of rotating slowly, like a top, and at times it makes the storm look like a stack of plates, or a flying saucer.
Fortunately, the mesocyclone is easy to detect with Doppler radar. It stands out immediately on velocity products and can be detected on NEXRAD at ranges of up to 100 miles. There’s no way to identify a mesocyclone on traditional airborne radar or on MFD displays, though the mesocyclone does tend to give storms a bit of curvature in their overall shape. This shape won’t be seen very well on C-band airborne radar because of radio frequency attenuation.
However, the mesocyclone will structure the storm in a way that causes very strong reflectivity gradients, in other words packing the blacks and greens very close to the reds, and will displace the core of the echo close to the edge. Strong updrafts also lift high intensities to unusual heights. On NEXRAD, when we see 60 dBZ at 30,000 feet, we know things are getting bad.
The Updraft
But let’s not forget the role of a powerful updraft. The strongest updrafts have speeds of 50 to 100 mph—definitely something you want to avoid. The rising air produces adiabatic cooling. Eventually the air contained within the rising parcels making up the updraft cool to their dewpoint. This produces cloud droplets. Because of turbulent flow within the updraft, size-sorting of drops into different terminal velocities based on their size, and other processes, these cloud droplets grow upscale into rain droplets.
Cloud droplets appear almost immediately as the updraft rises and produces a cloud base. This is usually at about 4000 feet and the cloud can often be directly detected by an ASOS site. Larger droplets take some time to appear, and by the time they can be seen visually and on radar, the updraft has often risen to 10,000 feet. Above this we can actually begin seeing these droplets on radar. The best radar returns are at about 15,000-20,000 feet, which is normally a subfreezing layer and contains graupel, wet snow, and rime ice, which are all highly reflective on radar and appear in menacing shades of red and white on most color schemes.
Most of this precipitation is already in the process of falling out of the updraft and initiating a cold, rainy downdraft. But in stronger storms, this precipitation cascade behaves a bit differently.
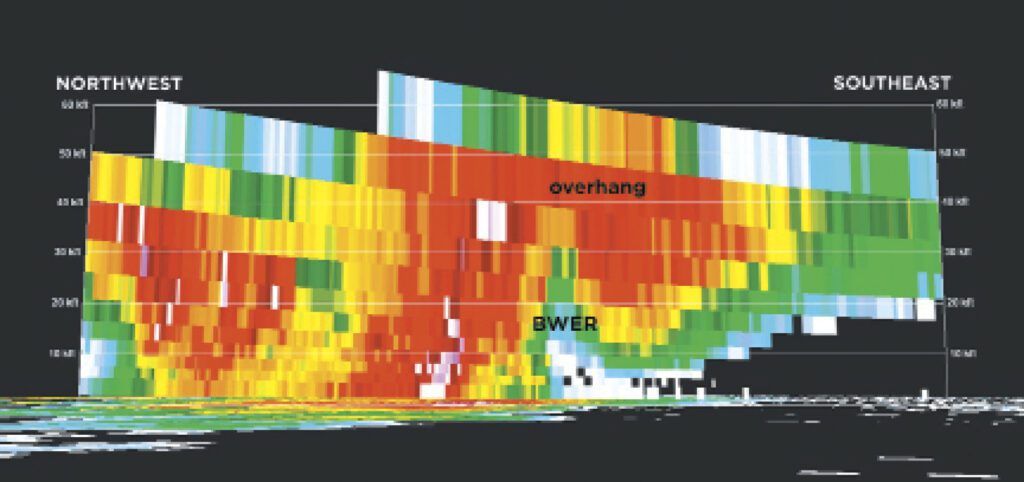
Powerful updrafts move upward with such great velocity that they tend to delay the raindrop growth processes until they are at much higher altitudes, like 20,000 feet. This makes a large part of the updraft “rain free,” or at least not visible to radar. Forecasters look for these areas using multiple radar tilts. These areas of missing reflectivity are called “weak echo regions,” or WERs.
On radar a WER looks like a concavity of weak or no reflectivity, topped by very heavy reflectivity called “overhang.” The larger the WER concavity and the more pronounced the overhang, the stronger the updraft, and by proxy, the more severe the storm, since updraft strength is directly correlated with storm severity.
You should already be learning that lack of yellow and red echoes on your MFD or mobile device, especially below 20,000 feet doesn’t necessarily mean you’re in the clear. Updrafts simply don’t have a radar signature until enough droplets and ice crystals have formed. Unfortunately the updraft is also the most violent part of the storm and is where tornadoes form. This can give false confidence to pilots using airborne radar or base reflectivity who are maneuvering under a storm cloud, trying to beat the rain to the airfield. The biggest risks are by far at nighttime, when pilots can get tunnel vision with the radar display.
Exceptionally strong updrafts, like those associated with tornadoes, will punch the WER up into the overhang, producing an upside-down bowl of weak echo returns. This is called a “bounded weak echo region” (or BWER). It’s one of the key indicators that forecasters use to spot early tornado potential, and is seen in only the strongest storms. A typical BWER might punch upwards from 15,000 to 25,000 feet. On rare occasions you might see this on airborne radar as a donut or a strong echo with a hole a couple of miles wide, surrounded by yellow and red colors.
The Tornado
While the mesocyclone and the severe storm itself are well understood, researchers are still grappling with the tornado problem: What exactly causes the tornado to develop in some storms, and not in others? After all, nearly all tornadoes come from supercells, but not all supercells produce tornadoes.
Much of the work focuses on the rear-flank downdraft (RFD), a column of descending air found on the back side (usually the west side) of the mesocyclone. The RFD and the weak rain and hail within it form much of the actual “hook” appendage seen on hook echo shapes. Tornado development seems sensitive to the temperature and moisture content within the RFD. It also appears that very small preexisting boundaries ahead of the storm, even smaller than those that are usually analyzed, play a role.
There are currently no forecast models that can predict any of this, so forecasters pay close attention to radar data and lean on nowcasting techniques and past experience. This is assisted by field reports from spotters, law enforcement, and chasers. In some cases, forecast offices might even tune in a YouTube chaser livestream to help assess what a storm is doing.
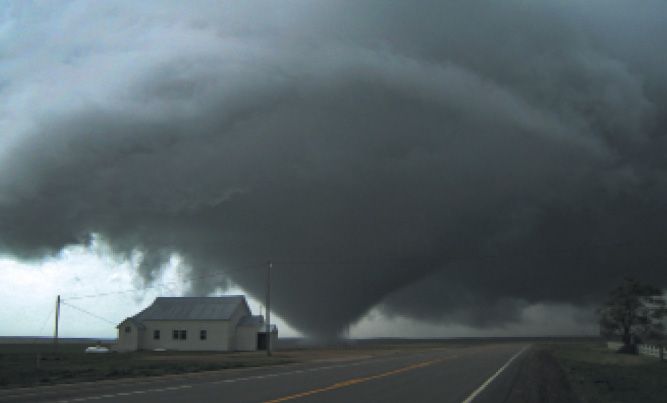
Visually, tornado development is preceded by formation of a large, dark updraft base and the development of a wall cloud, a lowering near the edge of the precipitation less than a mile wide that shows hints of rapid motion. For many decades, harmless and sometimes eerie-looking scud clouds have been misidentified as wall clouds by the public and by poorly trained spotters, and this is one of the things that spotter training still tries to discourage to this day.
Most wall clouds dissipate without anything happening. But in some cases wall clouds show acceleration of the cloud motion that makes up their structure, and more importantly, some wall clouds show strong rotation. It is both of these that are good indicators of imminent tornado development.
The tornado is not necessarily visible, so the ground must be watched for debris clouds and plumes. The tornado may either then dissipate or grow further, reaching up to two miles wide in extreme cases. Eventually its life cycle is followed by occlusion, as the rear flank downdraft wraps around it, either as a rain curtain or a “dry slot,” and envelops the tornado completely. A rope stage normally follows, where the tornado changes into a tall trunk or a ropelike shape. This might last another five or 10 minutes, then the tornado dissipates.
By this time, the tornado will have attracted a lot of attention. But the area a few miles to the east or southeast must be monitored for development of a new rain-free base and a new tornado. This is called cyclic development, and happens in a cyclic supercell. Some of the strongest tornadoes on record, and most long-tracked tornadoes, are spawned by a cyclic supercell. The Dallas tornado of October 2019, the fourth-most expensive tornado in U.S. history, is an example of a cyclic supercell. After the main tornado dissipated near Richardson, more tornadoes touched down further southeast in central Garland and Rowlett.
Spotter Training
If you want to learn more, spotter training is the best place to go. Most National Weather Service (NWS) offices in the central and eastern United States sponsor spotter training at least annually. This training is conducted by an actual NWS forecaster. You don’t need any special credentials, or have a radio license or be in a ham-radio organization. As a pilot, you’ll always be welcome to ask a few aviation-related questions at the end of the talk.
The downside is you’ll have to wait until sometime between late fall and early spring in most cities for the next spotter training date. Visit your local NWS web site and look for spotter training links, usually under a menu like “Local Programs” and “SKYWARN Training.” The new class dates are usually published between October and January.
Another good source for learning more is faasafety.gov. Go to the Activities dropdown menu, and select to Seminars & Webinars. In the search panel, choose “Show Only Webinars” and press the search button, and you’ll find free weather-related courses that fit your area of interest.


