Last month, we discussed upper-air charts and how they shed light on your flight plans. Now, let’s talk about surface charts. In the May 2021 issue we covered a little bit about surface charts, but focused mostly on how to read the station plots—the little groups of data found at each city. It’s time for a more in-depth look at weather patterns, as we put fronts and the ever-mysterious highs and lows under the microscope.
We’ll focus on two of the most fundamental weather patterns often seen during the fall, winter, and spring months: the prevailing high pattern and the Pacific storm-system pattern. Most of the interesting weather you encounter will fall into one of those two groups.
The Prevailing High
The prevailing high pattern describes a situation where a strong high pressure area of Canadian origin moves out over the Lower 48 as shown below. It’s fairly common during the winter months. The upper-level winds across the United States are often northwest-to-southeast during this pattern (“northwesterly”). The pattern is known for the extreme cold it brings, along with wintry weather in unusual locations.
Looking at the weather chart you can easily see how massive the prevailing high is. It covers everywhere from western Canada to Florida and Texas. This represents a large Canadian polar air mass originating from the Canadian Prairies, Yukon, and the Northwest Territories. The strength of this air mass can be estimated from the high pressure area’s central pressure. The station plots aren’t legible on this chart, but for this example the pressure is around 1045 millibars (hectopascals). Divide by 33.8636 to get a rough approximation of altimeter setting: that’s a quite high 30.85 inches.
Values in the 1020s are typical of weak polar outbreaks. We see these almost daily. When the values reach the 1030s, we’re talking about a classic, textbook polar outbreak. Values in the 1040s, like the one on this map, are typical of strong cold air outbreaks and might be seen once every few weeks during the winter. Indeed on this frosty January morning we see temperatures of zero as far south as Kansas and Indiana, and 20s down to the Gulf Coast.
When the values reach the 1050s, we’re getting into unusually strong territory. Such outbreaks can be expected to reach everywhere in the United States east of the Rockies, and often bring record-setting cold. The strongest outbreaks are in the 1060s, and might be experienced only once in several years. That gets you above 31.30” on the altimeter setting. Hopefully, you can still dial that in.
Visualizing Flow
Facts and figures aside, let’s start considering the weather pattern. Remember Buys-Ballot’s Law: with your back to the wind, low pressure will always be on the left in the northern hemisphere. The corollary to this is that high pressure areas in the northern hemisphere rotate clockwise, while low pressure areas rotate counterclockwise. The winds will also flow parallel to the isobars, with a slight crossing of about 20-30 degrees from high pressure to low pressure.
One of your first goals when looking at the surface chart is to visualize a simplified, general flow around the country. So without actually looking at the wind plots, we know that a cold blustery west-northwest wind is flowing across the Great Lakes, becoming northerly across the Carolinas into Florida. On the other hand, winds are southeasterly in New Mexico and Colorado. The tight packing of isobars tells us that the winds are strong here.
In fact, the pressure gradient here is typical of powerful winter storms that affect places like New York and Boston. However most of this sharp isobar gradient is focused on the Rocky Mountain Front Range itself, and does not extend over Denver and Cheyenne. This puts the pressure gradient on the passes and canyons, and here we often see strong foehn winds blowing through these areas.
Consider Terrain
As you visualize the flow, look at where the air is coming from and where it’s going. Cold northwest flow over the Great Lakes means lake-effect snows, especially during the late fall and early winter. Likewise, the cold offshore flow off the East coast and Gulf Coast flowing over the relatively warm ocean waters means the same thing: a sort of lake effect condition that occurs over the sea. Both are the result of destabilization through the addition of heat and moisture at the bottom of the air mass. Cold over warm means instability.
There’s also upslope and downslope flow to consider. Winds are out of the east between Dallas and Denver. This east wind is forced to ascend the Great Plains. Ascent always means cooling, increasing relative humidity, and a tendency toward cloud and precipitation formation. When I worked the counter at Dyess AFB near Abilene, Texas, all forecasters knew that an east wind was a red flag for possible IMC at night.
Downslope conditions cause warming, drying, and a tendency toward fair weather. On the chart we see downslope flow on the Canadian Prairies and in the Pacific Northwest. While the air here is quite cold, there’s lots of VMC to be found.
Active vs. Quiet Pattern
In a Pacific storm track pattern, it’s important to assess how active California, Arizona, and the southwest deserts are. Lots of clear blues skies and VMC indicates a quiet weather pattern. On the other hand, extensive clouds, precipitation, and frontal systems in the southwest tell us that an active pattern is underway.
Back on the prevailing high chart, we see rain falling at Fresno and south towards the Santa Barbara area, with low pressure near San Francisco. Clouds are extensive. That tells us everything we need to know: the pattern is active.
These weather systems should be considered as separate entities from the Canadian weather and the prevailing high pattern. They are of Pacific origin, migrating eastward over the Rockies. At this point they begin interacting with the Canadian air. Most commonly they ride over the top of the Canadian air mass, producing a sort of “elevated” weather system above the cold air. This in fact already appears to be occurring in Colorado, where widespread snow and low ceilings are present. Unusually strong systems however can carve out a new low pressure system in the Four Corners area and pick up the tail end of the Canadian front as the Pacific low migrates into Texas.
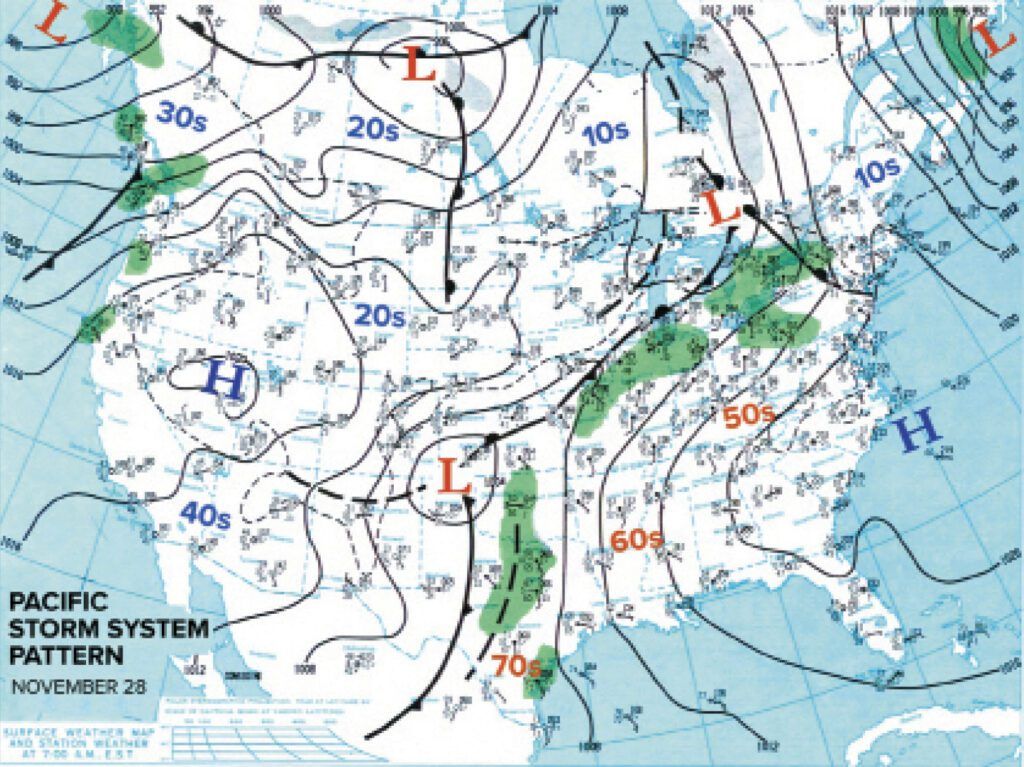
Pacific Storm System
A Pacific storm system pattern, shown above, occurs when the flow is strongly west-to-east, called a “zonal pattern,” or is strongly southwest-to-northeast. This brings strong weather systems from the North Pacific into California, Nevada, Utah, and Arizona, and moves them into the central United States. The Canadian regions show low pressure or widespread mild temperatures.
When there is no active storm coming from the Pacific, a large lee-side trough develops east of the Rocky Mountains. Weather at places like Denver, Aspen, and Dodge City is fair and mild, but extensive clear air turbulence often develops along and downstream from the Rockies.
Once a storm system moves into California, we see all the classic signs: IFR in the San Joaquin Valley and Sierra Nevadas, rain in the valleys, snow in the mountains, and a variety of problems in the Great Basin region as the storm moves east. The low pressure areas and fronts can be difficult to find on the surface charts since the rugged terrain disrupts the circulation and many of the indicators on the surface chart. Over a period of 24 to 48 hours the storm system reaches the Great Plains, and appears as shown on the chart. At this time a dryline sometimes develops in Texas and Oklahoma, and storms can form if there’s enough moisture.
Most of our attention focuses on the low pressure areas, but don’t forget to look at the trailing high pressure areas, as these usher in the cold air that helps support the front. In this case the trailing high pressure area is found in Nevada, and it originates from the North Pacific. Note that the pressure is only 1020 mb, quite weak compared to its Canadian counterparts. But it’s still strong enough to push a healthy amount of mild, cool air into the western states. Sometimes it begins blending with a cold Canadian high as the storm system moves through the central states, but that doesn’t happen in our example.
Consider the Flow
Again, it’s important to visualize the wind flow. Near the Great Plains low and its counterclockwise circulation we find deep southerly flow from the Gulf of Mexico spreading heat and moisture northward into the Mississippi and Ohio River valleys. On the other hand we find some cool northerly flow in Colorado, New Mexico, and Nebraska. Some of this extends into Arizona, where we find a cool 39 degrees at Tucson to start the November morning.
In Washington and Oregon, southwesterly flow is always associated with dreary weather and IMC, and this is certainly the case here. The Pacific Ocean is wide open, and places like Seattle and Portland are vulnerable to frontal systems moving in and bringing showers and deteriorating weather.
Severe Weather
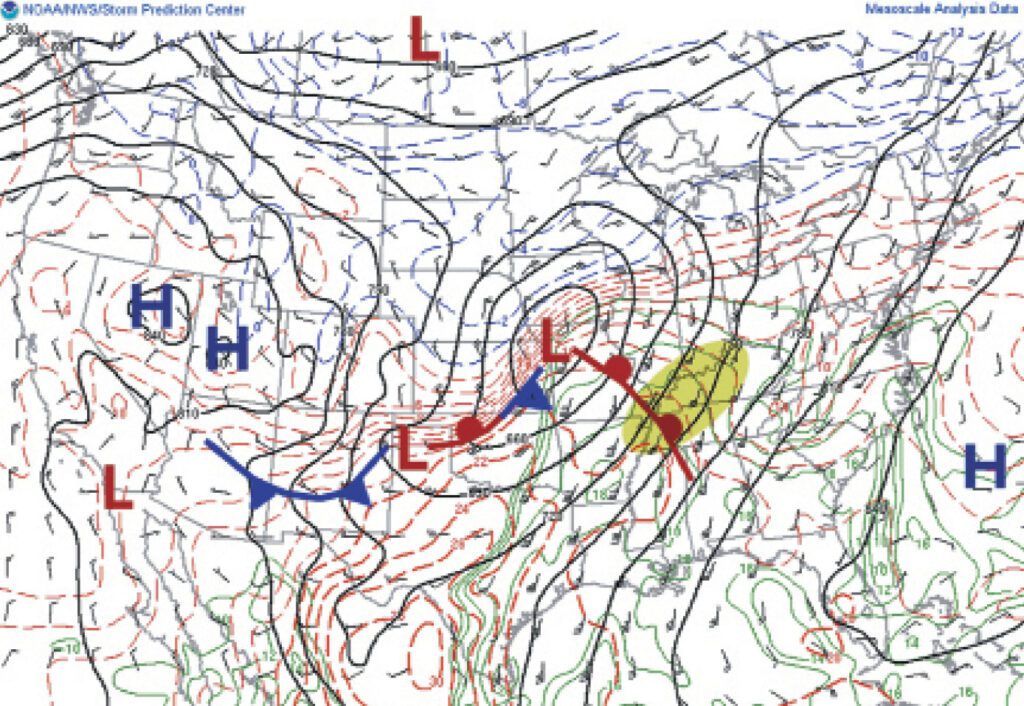
The Pacific storm track pattern is responsible for most of the destructive cold season supercells, squall lines, and tornadoes in the southeast United States. A classic example is the tornado outbreak of December 10, 2021 that affected a broad area between Arkansas, Illinois, Kentucky, and Tennessee as shown above. At least 71 tornadoes touched down including a 166-mile long-track tornado that killed 57 and injured 515 and leveled a candle factory where 110 workers were on shift.
While we often think of tornadoes as a springtime event on the Great Plains, locations throughout the southeast United States reach their peak tornado risk between November and April. This zone is roughly south of a line from Dallas to Nashville to Charlotte and extends southeast to Tampa and Orlando. Severe thunderstorms should always be considered a potential risk here during a Pacific storm track pattern.
The best indicator of a threat is the temperatures and dewpoints ahead of the cold front, an area called the “warm sector.” Back on the Pacific Track chart on the previous page, I’ve drawn temperatures in the warm sector in a reddish color, emphasizing their importance to a possible severe weather event. The dewpoints, located at the bottom left of each station plot, showed values well into the 60s in Houston and Dallas, which is a red flag for late November. If I were planning a flight, my next stop after seeing readings like these would be the Storm Prediction Center convective outlook to see if any storms are forecast.
Also note how several isobars extend into the Gulf of Mexico, implying a flow from the southeast onto much of the Gulf Coast. This pattern is considered to be an “open Gulf,” suggesting that tropical moisture will feed into the southeast states for at least 24 to 48 hours. For today, there is a risk of storms for Texas and Louisiana, but a threat can be expected to spread eastward as the cold front marches east.
Forecasting Storm Track
Which way will the low pressure area in the Texas Panhandle move? Frontal lows tend to closely follow the thermal gradient. We see a strong temperature contrast between Arkansas and Nebraska, and between Ohio and Lake Superior. This marks the “baroclinic zone” and gives us an estimate of where the Texas low will move over the next 24 to 48 hours. In reality, it moved slowly and ended up in Ohio two days later.
However frontal lows are not steady-state systems and gradually occlude as cold air gets wrapped into the circulation. This forces the associated cold front and warm front to break off and shift south towards the warmer air. Dynamic instability leads to development of a new wave on the front, which deepens into a new frontal low, and the cycle begins anew. This in fact happened two days after the pattern shown on the chart on page 21, as a new low formed on the cold front in Louisiana and deepened over Alabama.
This low would move up the east coast, grazing Boston and Nova Scotia with a so-called nor’easter. And perhaps that’s a topic for our next article.
Tim Vasquez is a professional meteorologist located near Dallas, Texas, where he writes books, develops weather software, and hosts a YouTube channel called Forecast Lab.