
Just 40 years ago, a pilot’s only real access to live radar data was in the cockpit of a sophisticated multi-engine aircraft. But thanks to rapid advances in technology and computer networks, anybody carrying a smartphone has access to nearly all of the data from the federal government’s $3 billion radar network. Add ADS-B In to the mandated Out, and you can reliably get all this data when airborne. This radar network is known as NEXRAD, Next Generation Radar, and is made up of 160 WSR-88D radar sites.
While this provides great convenience and helps pilots breathe easy, the fact remains that the United States has some of the most dangerous convective storms in the world. It’s essential that every pilot knows not only how to get the data, but also how radar works, to understand what they’re seeing, and where interpretation might go wrong. There’s more to it than just looking for the red spots.
The Basics
You’re probably already familiar with the basics of radar: a transmitter emits a pulse and a receiver listens for the echo, or backscatter reflected from an object. This gives us an azimuth and a range, with azimuth determined by which way the antenna is pointing, and range given by the speed of light and the time elapsed.
But wait—there’s more: reflected power (“reflectivity”), and velocity, which gives the magnitude of the air motion at any given location with respect to the radar site (never perpendicular to the site). An upgrade to NEXRAD in the early 2010s also gives dual-polarization information like differential reflectivity and correlation coefficient. We won’t worry about “dual pol” data as only forecasters are interested in that, but it does give useful information on the size and shape of rain and ice particles.
Most of what pilots are interested in is reflectivity (often known as “intensity.”) Velocity is less intuitive and requires some training to be able to use properly. It can be used by pilots sitting on the ramp or waiting inside the FBO to find dangerous circulations such as microbursts, downbursts, and tornadoes. But because of the high workload in the cockpit and the complexity of interpreting images, this is not practical to do inflight.
Some pilots may have run across a radar overlay known as “turbulence”, which is a post-processed version of velocity data. This can be used by pilots because it requires little interpretation and directly indicates where there is a large distribution of velocities, which can be due to strong circulations or a mix of particle sizes with different terminal velocities (rain and large hail are the usual culprit). Such areas are definitely worth avoiding.
Knowing Your Radar
A mistake that I see a lot with both novice pilots and laypeople is not knowing where the radar data comes from. I don’t think enough emphasis is placed on this, and it’s important now that radar comes from a smorgasbord of different sources.
With airborne radars, it’s as simple as it gets. The radar is looking ahead, much the same way as you look out the window. But if your data comes from a smartphone app or from ADS-B, it’s coming from the NEXRAD network. Things get trickier here, but I’ll walk you through the steps that go through my mind as a longtime aviation forecaster.
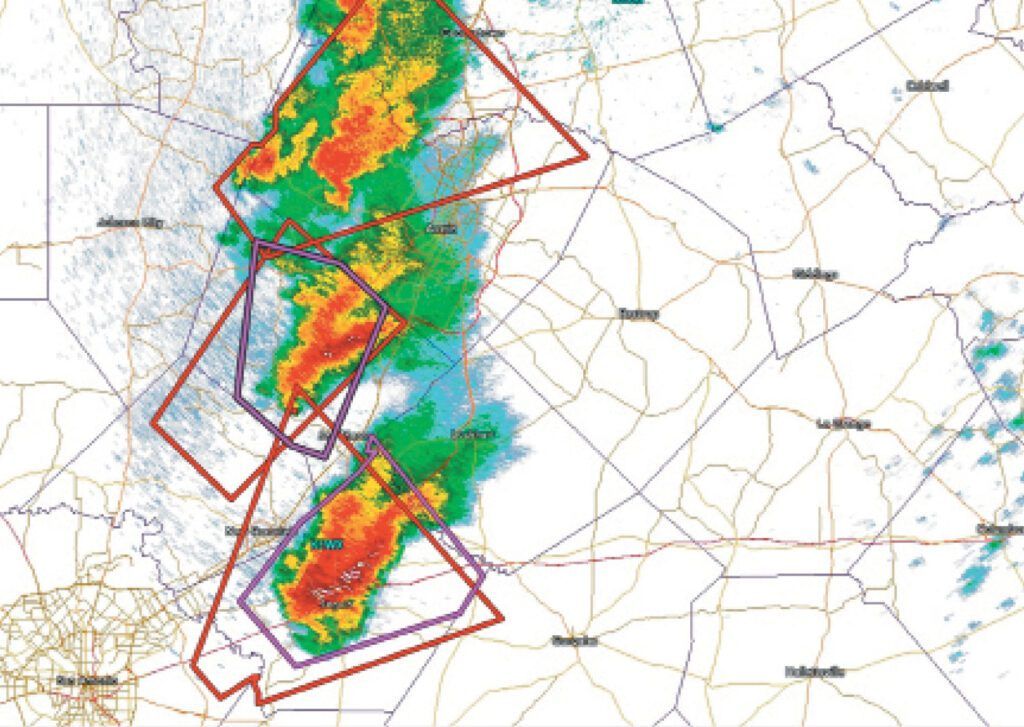
Once I know we’re looking at NEXRAD data, the next big question is whether we’re looking at a mosaic or a single-site image. This depends on your source of data. Even smartphone apps will vary from one to the next. Maps that span 500 miles or more are almost always mosaics and are built by combining the images from multiple radars into one image.
Television stations often use these when showing the weather across the state or nationwide, and services like SiriusXM weather use mosaics as well. The advantage with a mosaic is that a large number of radar sites are used, so this gives you substantial coverage and it’s great for planning a long route.
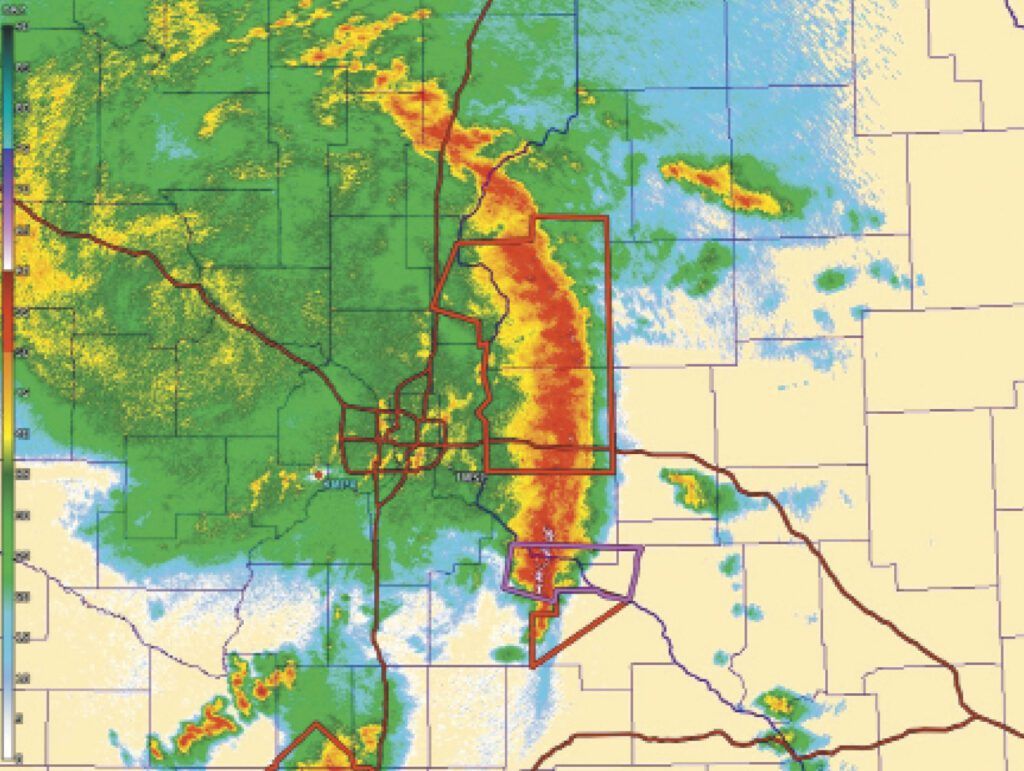
Single-site images use only a single radar transmitter. If you’re asked to click on a specific radar site before you view the data, you’re probably being served a single-site image. If you zoom out on the image and the precipitation forms a large circle that looks like a radar scope, that’s another indication you’re using a single-site image.
As a forecaster I prefer single-site images as I can immediately understand how a storm is being sampled. If the sampling is poor, I just switch to a different radar site. But I am also biased: forecasters prefer working with granular sources to get as close to the original observations as possible. We get uncomfortable when there’s too much processing of data. But as a pilot, you want to know where all the precipitation is, so a mosaic is always a good tool to use. With single-site images, you have to look for blind spots and check other radars along your route.
Another important part of understanding radar data is knowing whether you’re working with base reflectivity or composite reflectivity data. These have enormous differences. Fortunately it’s easy to understand.
Base reflectivity is the radar data exactly as it was received from a single sweep through 360 degrees around the horizon. It only shows one specific radar elevation tilt. A WSR-88D site always samples about a dozen different base tilts from half a degree up to 19.5 degrees above the horizon, with the radar beam only measuring one degree wide (much less than airborne radars). In practice, forecasters mostly stick to the half-degree tilt except when dissecting a storm.
Composite reflectivity is a post-processed blend of all available tilts, showing the maximum reflectivity above a given location on the ground. This means that if precipitation is detected at a high tilt but not at a low tilt, it will show up on composite reflectivity but not on a low-angle base reflectivity.
Which one are you looking at? It’s important to know this to get the most out of radar information. But again, radar apps and display systems don’t always make this clear and often hide the details to help simplify their product. Sometimes it’s indicated in the legend, but other times it’s not obvious. As a forecaster, my favored technique is to compare the image with a known base reflectivity image and see if they look the same. A different presentation with more blooming of precipitation patterns indicates a composite reflectivity image.
As you might guess, composite reflectivity looks at all elevations and makes sure we don’t miss anything. A good rule of thumb is radar mosaics typically use composite reflectivity, in the spirit of displaying all precipitation. With single-station images, it’s a tossup. Many apps and websites offer both base reflectivity and composite reflectivity, so it pays to understand the difference and know how to access the one you are interested in.
If you’re interested in identifying classic supercell shapes and locating tornadoes by their telltale hook echoes, you want to use base reflectivity images, because this gives you a thin slice of the storm and reveals its shape and structure. On composite reflectivity, these shapes are always smeared by the combination of multiple tilts blended together. For a pilot navigating near storms, high reflectivity is the most reliable indicator of hazardous weather, so I recommend composite reflectivity if you have a choice of products and sticking with that. Composite reflectivity is always a good go-to radar product and is suitable for both planning before takeoff and for monitoring your route in flight.
Finding Dangerous Storms
A question I often get is how to identify dangerous storms. Fortunately there are a few good rules of thumb you can use.
The most favored technique is identifying high levels of reflectivity (intensity). Older pilots from the 1980s (and Weather Channel enthusiasts from that era) probably remember looking at the old Kavouras displays and finding the reddish VIP 5 and VIP 6 echoes, which often were made to flash to alert the user. Not much has changed: these days you still look for the reds and whites and avoid them.
This is based on the principle that wet, rimed hailstones and extremely heavy concentrations of rain will scatter the most radar energy. Both of these precipitation types require a strong updraft in order to exist. A strong updraft directly correlates to severe turbulence, and is more likely to support high velocities within the storm and anomalous circulations like downbursts and tornadoes.
Not all dangerous storms produce high intensities, however. During the middle of summer when freezing levels are high, strong circulations might exist but very little large hail reaches the ground. High intensities might show on the composite reflectivity product and by airborne radar, but base reflectivity might show weak intensities.
Likewise, highly sheared environments like those in the southern United States during cold season outbreaks and in low-precipitation (LP) supercells along the dryline can produce enormous circulations without a particularly strong updraft. The sheared environment also disperses radar scatterers like hail and heavy rain across a wide area downstream, so not as much energy comes back to the radar. (Remember radar measures the total backscatter in a sample volume, so if hailstones are spread out, they don’t reflect as much.)
So the lack of strong intensity does not necessarily mean the storm is weak. This is one reason the FAA teaches that all storms are dangerous. It’s also why forecasters look at all available data: radar, visual indications, gut feeling, and the general situation according to other forecasters at other offices.
Another clue you can use is to look at reflectivity gradients. Where you see tight packing of strong intensities against weak intensities, especially in the form of an asymmetric, intense core positioned on one specific side of the storm, rather than a symmetrical bullseye shape, this indicates a hazardous area of the storm. There is a very good likelihood of downburst winds, microbursts, large hail, or a tornado in or close to this location and it should be given a wide berth.
Base reflectivity, including airborne radar, is the best tool for finding these features. The technique is questionable for composite reflectivity due to the blending of different tilts. If you spot such gradients on composite imagery it is always wise to treat it as a dangerous area, but the lack of a gradient means nothing.
Radar & Storm Organization
The shape and appearance of individual cells is something forecasters consider, but it requires the use of base reflectivity and a working knowledge of the basic storm archetypes. Some simple examples are the triangular shape or “flying eagle” appearance of supercells, and the rear-inflow notch often seen in downbursts. This is not something that can be done easily in the cockpit. For those who have a fascination with severe weather, a quick Internet search for those terms will lead you down a rabbit hole of information.
However the degree of organization of storm cells across tens and hundreds of miles, is something that can be readily seen on all radar tools including airborne radar. When cells are relatively isolated (as a general rule about 30 miles from any other cell), we refer to these as “discrete” cells. If conditions are favorable for severe weather, discrete cells are the prime candidates for growth into hailstorms and tornadic cells, particularly when they are out ahead of a line. These should always be given a wide berth when SIGMETs are in force and the severe risk is “slight” or higher.
Nondiscrete cells behave differently because they tend to work cooperatively to develop a shared, common cold pool, that is, a pool of outflow air originating from the downdraft. This cold pool often generates new cells along its leading edge. When instability and shear are limited, such as in July across Florida or Texas, a common cold pool results in a multicell cluster. These are the familiar jumble of disorganized storms that cause problems for a few hours and then dissipate by sunset.
When upper-level winds are stronger, such as during the transition seasons or in winter, a common cold pool results in upscale growth into a squall line, with dimensions spanning hundreds of miles. When there is a solid squall line with a well-developed cold pool, supercells, tornadoes, and large hail are not really favored. This is because portions of the line are competing with one another for moisture and the storm itself is essentially a two-dimensional system.
But when you see breaks in the line or part of the line bowing outward, expect trouble. In a way, it violates the pact all cells have with one another to share the fuel equally. Bowing or convex squall line structures at the very least indicate the possibility for strong straight-line winds and derechos. Brief, shallow tornadoes known as QLCS (quasi-linear convective system) tornadoes may also develop near these bowing structures.
Tim Vasquez was an Air Force aviation forecaster and holds WSR-88D certifications from the original radar manufacturer. You can find dozens of new forecasting videos every month on his YouTube channel by searching for “Forecast Lab.”


