Those extra 30 ponies up front on the mighty Cessna 172SP tend to cause nosewheel landings—at least they do for me—and it was time to go out and knock the rust off my landings to keep the nosewheel safe. I awoke to a sunny morning after showers the previous evening and clicked through the weather while sipping my morning coffee. METAR green, nearest TAFs green, I was ready to go.
While I was driving to the airport a layer of radiation fog condensed and became a pattern-smashing iron plate by flight time. While waiting for tower to cut the next ATIS, I poked around weather forecasts and noticed that the MOS forecast predicted, correctly, low ceilings for the rest of the morning. Argh!
Radical meteorologists developed Model Output Statistics (MOS) forecasts in the late sixties. Forecasters today use the product when creating TAFs. Many pilots’ first interaction with MOS forecast is via ForeFlight, which is the only app I’ve found that integrates the reports into their weather package.
MOS provides TAF-like forecasts for approximately 1700 airports. A MOS forecast doesn’t replace a TAF or Graphical Area Forecast for alternate planning, but they provide an airport-specific forecast similar to a TAF for those airports that don’t have a TAF.
MOS, GFS and LAMP
The concept is simple; the math is complicated. MOS takes non-specific weather forecast data and applies it to a specific point. Mesoscale (meso: mid, for our purposes 1 to 100 km or 0.6 to 60 SM) weather models output data in a grid format, like a mesh covering the earth, designed to forecast large-scale atmospheric gyrations.
Developing point-specific forecasts requires an interpolation of grid data. This is done using MOS math, but it isn’t that simple. The MOS formula also corrects the interpolations with prior observations at the airport and geo-climatic data. Think of MOS as an app that runs on top of a weather model operating system.
The National Weather Service runs MOS on a handful of models but the most commonly used one for aviation is the Global Forecast Model (GFS). Often MOS reports will be labeled with the model used, such as GFS-MOS. To learn even more about MOS, read Tim Vasquez’ article “Hidden Weather Tool” in the March issue.
To improve granularity, MOS needs LAMP, the localized aviation MOS program. LAMP updates the GFS-MOS on an hourly basis out to 25 hours. It was originally designed to work with the NGM MOS (another base model), but was updated to use the GFS model. LAMP is the basis of the ceiling and visibility portion of the Graphical Area Forecast.
Finding and Reading
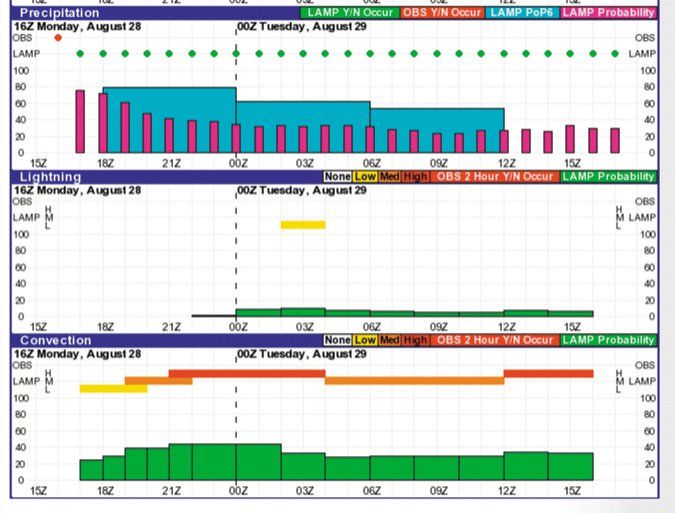
Few sources embrace MOS as well as ForeFlight. Fortunately, your tax dollars publish MOS and LAMP information online for free. The most interesting LAMP display is the “GFS-LAMP Meteogram” that can be found with a simple web search. A meteogram is a graphical presentation of meteorological data with time being an axis.
Following the link reveals the 25-hour LAMP forecast with easy-to-read graphs covering temperature, dewpoint, wind speed, gusts, sky cover, ceiling, visibility, obstruction to visibility, precipitation, lightning, and convection. The precipitation forecast can be a little confusing because it contains two types of predictions; whether any precipitation will occur that hour (marked in pink) and if any measurable precipitation will occur over six-hours (marked in blue). The lightning and convection graphs also combine two into one. The bottom portion indicates probability and the top graph shows severity.
Air Sports Net also does a great job of graphically displaying MOS forecasts. Go to www.usairnet.com and use the Weather pull down to select Aviation Weather. Navigate to your state and locale or airport. The display is self-explanatory and similar to displays found on general public weather sites—even a non-aviation person can understand it and find it useful. Another plus is that it spans up to about three days, making it good for looks ahead.
MOS charts can be found by searching for “MAV MOS Graphics.” This NOAA website can display graphs of temperature, precipitation, thunderstorms, cloud heights, visibility, etc., for the contiguous 48 U.S. states and Alaska. These are best used for planning a couple of days out because closer to flight time, it’s better to look at an actual airport’s forecast.
If you want to get technical, check out the textual (also called the tabular format) MOS and LAMP reports on the National Weather Service website. The textual LAMP and MOS reports are similar. Refer to Tim Vasquez’ article for more information on reading textual MOS forecasts.
Putting it to Use
MOS and LAMP forecasts are location specific and detailed. Yet, they aren’t adequate replacements for a TAF or Graphical Area Forecast if a TAF isn’t available. Even though the FAA doesn’t prescribe which weather reports and forecasts a GA pilot must use, the AIM notes that “some data on display by government organizations, or government data on display by independent organizations may be unsuitable for flight planning purposes.” Basically, only the weather products found on ADDS are guaranteed to meet “user needs and technical readiness requirements.” (AIM 7-1-3 c. through g.)
MOS and LAMP processing doesn’t fix a bad forecast. If the model is faulty, the forecast will be wrong—like any computer, the GIGO principle applies (garbage in, garbage out). MOS can also contain biases. Microclimates can have big effects on weather at airports around water or mountains. Additionally, the accuracy of the models degrades during highly irregular conditions. Just when a forecast is most needed, the accuracy can be reduced.
Comparing METAR, TAF and MOS reports during bad weather often reveals differences significant for instrument pilots. For example, one afternoon at Fort Worth the TAF forecasted a 500-foot ceiling, MOS less than 100 and the actual METAR for the period ended up being 600-foot overcast.
So, why should you add checking MOS/LAMP forecasts to your preflight checklist?
First, use it to validate and verify the official forecast. The Graphical Area Forecast utilizes the grid output of the Rapid Refresh (RAP) model to forecast clouds and winds. If MOS forecasts worse weather, err on the side of caution.
Second, weather forecasts for ceilings and visibilities are used to fulfill legal flight planning requirements of 91.169, not prudent decision making. For example, most planes can’t—okay, “shoudn’t”—land with tailwinds exceeding ten knots. Filing an alternate with impractical winds isn’t a big deal with conditions barely requiring one. When conditions are tight and weather at the alternate is marginal, you might want to plan using airports you actually want to fly to (like an alternate that has after-hours fuel, ask me about that one!).
MOS/LAMP forecasts can provide the granularity to apply personal minimums effectively. By definition, an airport without a TAF will have fewer services. These are exactly the types of fields—non-precision approaches, circling only minimums, no radar—where a more in-depth weather report can sway the go/no-go scales.
Finally, why not get more information about the weather if it’s available and easy to digest?
MOS takes a gridded forecast model and applies it to a specific location. Generally, the National Weather Service’s Global Forecast System (GFS) model is used. If the three-hour forecast period isn’t specific enough, the Localized Aviation MOS Program (LAMP) provides hourly forecast conditions.
These products provide TAF-level forecasts for airports without TAFs. Almost 1700 locations have MOS forecasts. They aren’t a replacement for the Graphical Area Forecast or a TAF. But, a MOS forecast might save you from running out to the airport to do touch-and-go’s when instrument approaches are the way to go
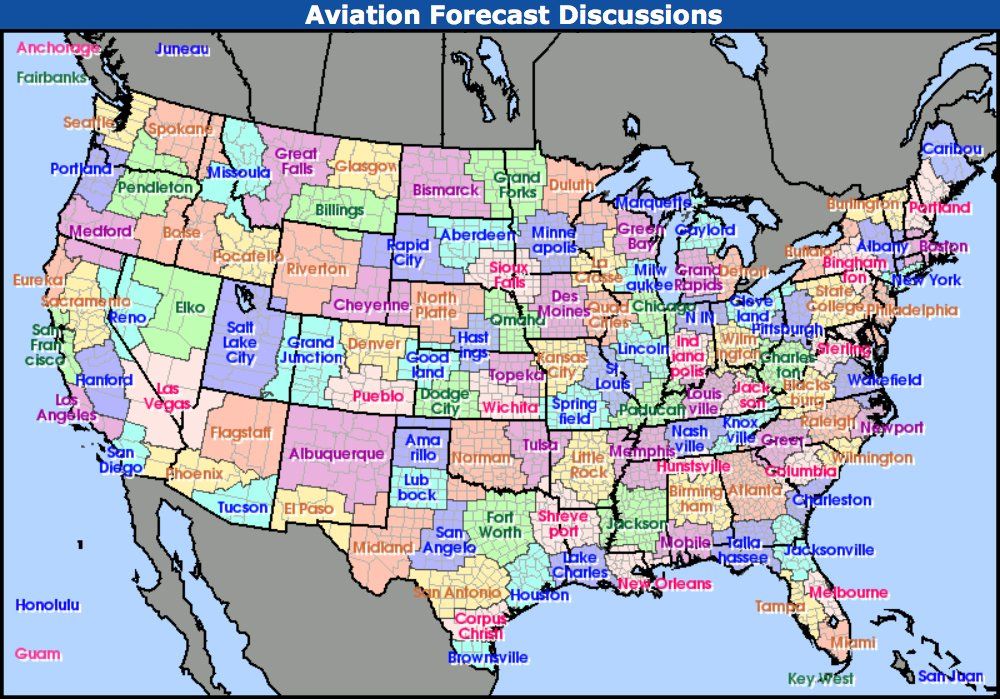
Aviation Forecast Discussion
An enormous amount of weather data is available for those who geek out on such things. Most websites and services cover the basics, some add a little pizazz. For example, 1800wxbrief includes links to the Lifted Index/K Index analysis and Skew-T/Log-P diagrams. While these products are great for dorking-out on weather, they don’t provide simple, practical takeaways.
The Area Forecast Discussion at aviationweather.gov/fcstdisc, conversely, furnishes useful descriptions of weather for aviation and life. It’s “intended to provide a well-reasoned discussion of the meteorological thinking which [sic] went into the preparation of the Zone Forecast Product,” according the National Weather Service. The Zone Forecast Product serves community size areas and is the basis for much of the consumer level weather we get in apps and on the nightly news.
Part of the Area Forecast Discussion addresses aviation and discusses the weather conditions that influenced creation of TAFs. Similar to TAFs, the discussion is released every six hours.
While the Area Forecast Discussion won’t replace TAFs or Graphical Area Forecasts, they are a good resource for increasing your weather situation awareness and learning what’s piquing the interest of forecasters. —JM
Jordan Miller is an ATP and CFII. He always checks weather to ensure an excuse is at hand for sporty landings.