
Some of us might find it surprising that 20 years have passed since The Matrix and Britney Spears were cultural sensations. While we might argue that popular culture is trending downhill, U.S. airline safety is steadily improving, in part from over 52 years of collaboration between the NTSB, the FAA, and manufacturers. (Notwithstanding Boeing’s latest, um, adventures.)
One of the last weather-caused airline crashes in the United States was American Airlines Flight 1420 in Little Rock on June 1, 1999. As we mark its 20th anniversary, we’ll tie together some of the radar and thunderstorm skills we’ve learned in previous articles. You’ll also see brand-new radar scans of the storm from modern high-resolution display software—which is far more detailed than that in the NTSB report—and we’ll contemplate what you might see if you encounter a similar storm on modern radar today.
Departing DFW
Flight 1420 was a McDonnell Douglas MD-82 scheduled to depart from Dallas-Fort Worth Airport at 8:28 p.m., but delayed at the gate due to weather. The delay led to the airplane being replaced, but eventually all 139 passengers boarded, filling the flight.
Both crewmembers were former military pilots. The 48-year old captain served seven years in the Air Force flying B-57 Canberras, and was hired by American Airlines in 1979. The 35-year old first officer served in the Navy, then was a corporate pilot for several years. The crew accumulated 10,234 and 4292 hours of flight time, respectively. Their day started mid-morning in Chicago, where they flew a flight to Salt Lake City and another to Dallas.
The weary pilots had been awake for 15 hours, and were again running their checklists. The plane pushed back from the gate and took off at 10:40 p.m.
Nearing Little Rock, the crew could see lightning ahead. Just before descent and 90 miles to go, foreshadowing what was to come later, the first officer said, “I don’t like that, that’s lightning.” Presumably looking at the radar, the captain said, “We gotta get there quick.”
At 11:40 p.m., as Flight 1420 descended through 4000 feet into Little Rock, ATC vectored the plane into a long right turn (light blue line, next page, bottom-right image) to slow it and get it to the initial approach fix. This was an important event, as the crew lost their onboard radar presentation, facing away from the storms for almost seven minutes. This gave them no opportunity to monitor the radar picture.
After a couple of vectors, the airplane finally rolled right onto the base leg, with the storms filling the radar once again. As if watching the radar, the first officer said, “Aw, we’re going right into this.” At that same moment, the tower reported heavy rain, less than a mile visibility, and a 3000-foot RVR.
Where Things Went Wrong
It could be said that during the first 50 years of aviation, weather-related crashes occurred mostly due to inexperience, bravado, and lack of information, while in the second 50 years, they occurred mostly due to failures of procedures, many of which were developed from those early lessons. In this case, Flight 1420 omitted a vital step that started the ball rolling: the failure to complete the pre-landing checklist.
This led to the spoilers not being armed, the autobrakes not being set, and landing flaps not being set. Although the runway was 8300 feet long, the misconfiguration proved to be one link in a cascade of failures. To further shave the margin of error, the airplane was fast on final at about 156 knots—25 knots above Vref.
A strong left-to-right crosswind developed, moving the airplane off center. The captain, who was flying the plane, applied left rudder and right aileron to crab the plane into the wind. Descending through 1000 feet, he commented, “This is a can of worms.” The strengthening crosswinds gradually blew the airplane further off centerline. Nearing minimums, the airfield came dimly into view through the rain but was off to the side, prompting one of the pilots to exclaim, “Aw #&%$, we’re off course” and “we’re way off.” Eventually, the captain wrestled the aircraft back on center and set the plane down 2000 feet beyond the threshold, leaving 6300 feet of runway.
Touchdown was at 145-150 knots. The spoilers, not being armed, did not deploy, and the misconfiguration went unnoticed. This resulted in the wings still carrying most of the airplane’s weight, rather than the landing gear. Thus, the tires lacked traction and the brakes were not effective. The first officer yelled, “We’re sliding!” as the airplane initially headed for a runway excursion off the right side, then slowly curved left, departing the left edge of the runway. The crew was unable to recover.
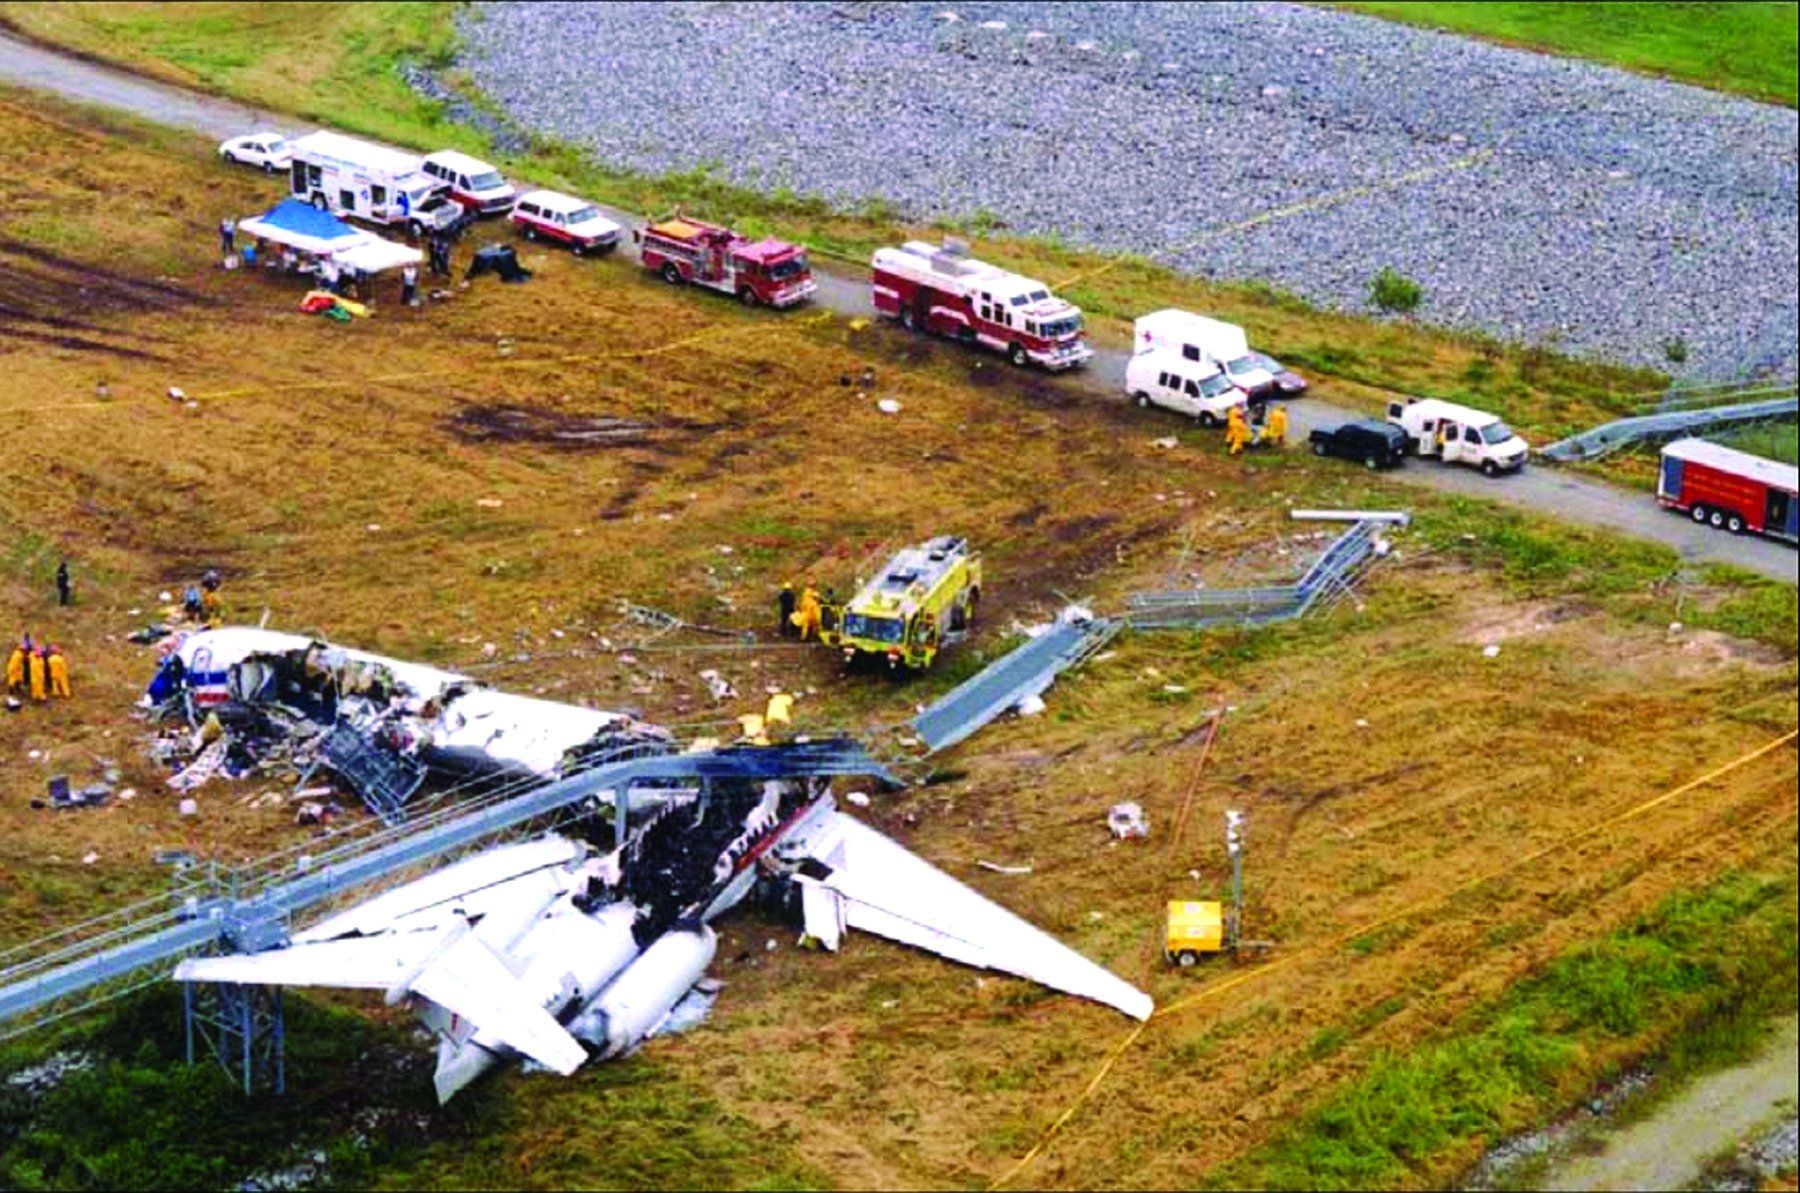
The plane’s left tires crossed the left edge of the runway, then the airplane rolled past the threshold at a speed of 75 knots. It continued another 800 feet, colliding with fences and an ILS facility. Slowing to 30 knots it made final impact with a solidly anchored approach light structure.
The captain and 10 of the 139 passengers died in the crash, with two succumbing later to injuries. The first officer, three of the four flight attendants, and 41 passengers suffered serious injuries. Most of the fatalities and injuries were over the wing where the fuselage broke in half, and near the left front side that took the brunt of the impact with the approach lights.
The NTSB listed the cause of the accident as “the flight crew’s failure to discontinue the approach when severe thunderstorms … had moved into the airport area” and their “failure to ensure the spoilers had extended after touchdown.” Also cited was crew fatigue, exceeding crosswind limitations, and excessive reverse thrust.
A Look at the Storm
The radar illustration (above) shows us the ground-based NEXRAD presentation just one minute after the crash of Flight 1420. Reflectivity (top left) is proportional to how much power is backscattered from solids such as rain drops, graupel, and ice. The highest values, indicated by the darkest red shades and the white pixels, correspond to the storm core, just beginning to engulf the airport. Here is where precipitation is likely to be heaviest. Had it not been June, there would likely be a significant risk for hail in this core.
Locating the core also gives good information on wind fields. Since these cores normally correspond to a downdraft, we can assume there is always outflow immediately surrounding the cores. This rule of thumb puts Flight 1420 under a region of northwesterly or northerly outflow wind from the core nearby.
Velocity
Velocity (top right) adds a whole new dimension to the picture. This is so valuable that it was the main reason the NEXRAD system was commissioned in 1988. Here we can really visualize the air flow. The only catch is we can only see the component of motion toward and away from the radar, which is at the top of the image where, on reflectivity, the radials seem to converge. Meteorologists use warm colors (reds) for outbound velocities, and cool colors (greens and blues) for motion toward the radar.
To learn what’s happening on velocity, we start with the big picture and work our way down to the details. The broad area of reds and purples indicates outbound velocities from the radar site at the top of the image. This means the air is moving from north to south, indicating it is likely cool outflow from the thunderstorm cluster.
We also see a small blob of enhanced outbound velocities sitting right over the runway. As this feature only has a diameter of less than a mile, it could be considered a weak microburst. The strong velocity gradients around its edges illustrate significant variations in airspeed, in this case 30 knots of deviation over less than 1000 feet. In fact, the tower reported winds of 350 at 34 gusting to 45 knots as Flight 1420 turned final.
The velocity image shows this was not like the microburst that affected Delta Flight 191 in 1985. In that case, the microburst was centered over the approach path, leading to a dramatic airspeed loss on the last mile to the runway. For Flight 1420, a downburst was centered over the runway itself, putting the airplane almost entirely in a strong headwind. However, there’s no question the airplane had a rough ride. Had the downburst been a mile further south the outcome might have been even worse with the loss of headwind coupling with the high airspeed. Another 300 feet of ground roll would have put the plane in the Arkansas River.
Mysterious Spectrum Width
Spectrum width (bottom-left) is not a product we usually see, but some pilots might be familiar with it from specialized apps such as RadarScope or desktop programs like GRLevelX. This product shows the diversity of velocities occurring within the scan volume, revealing even more. This is mostly a function of the diversity of precipitation types. Mixed ice and liquid particles have some of the greatest differences in terminal velocity and will show high values of spectrum width. It’s also good at showing insects and birds, which have relatively chaotic movement.
On the other hand, large areas of low spectrum width indicate a relatively uniform precipitation field. We see this over the runway, indicating Flight 1420 was probably immersed in a zone of heavy rain, and it likely contained no hail.
Spectrum width is also useful for finding boundaries; in this case we do see an outflow boundary (lower-right of frame) about eight miles south of the airport. This same boundary passed the airport 11 minutes before Flight 1420 landed, prompting a wind shear alert.
A More Detailed Look
What can we tell about the thunderstorm cell? With the outflow boundary being far to the south, we consider this an outflow-dominant storm complex. Granted, this will be difficult to recognize in the cockpit with basic reflectivity products, but occasionally you’ll see storms are enclosed by a ring-like feature that shows up on radar. This is an excellent clue that identifies the outflow boundary. Once you see it, you’ll want to look at how far it has spread from its parent storm. Normally if all of it is less than a few miles from the storm, we characterize the storm as inflow-dominant or balanced. If the boundary has spread more than several miles away, the storm is considered outflow-dominant.
Since an outflow-dominant storm is immersed in a pool of cold outflow, the likelihood of a tornado and large hail is low, and it’s destined to start weakening. These storms often spawn new cells miles away to the northeast or southeast while the old ones dissipate. So you’ll need to be careful when deviating just ahead of a line—one reason the FAA recommends 20 miles of separation.
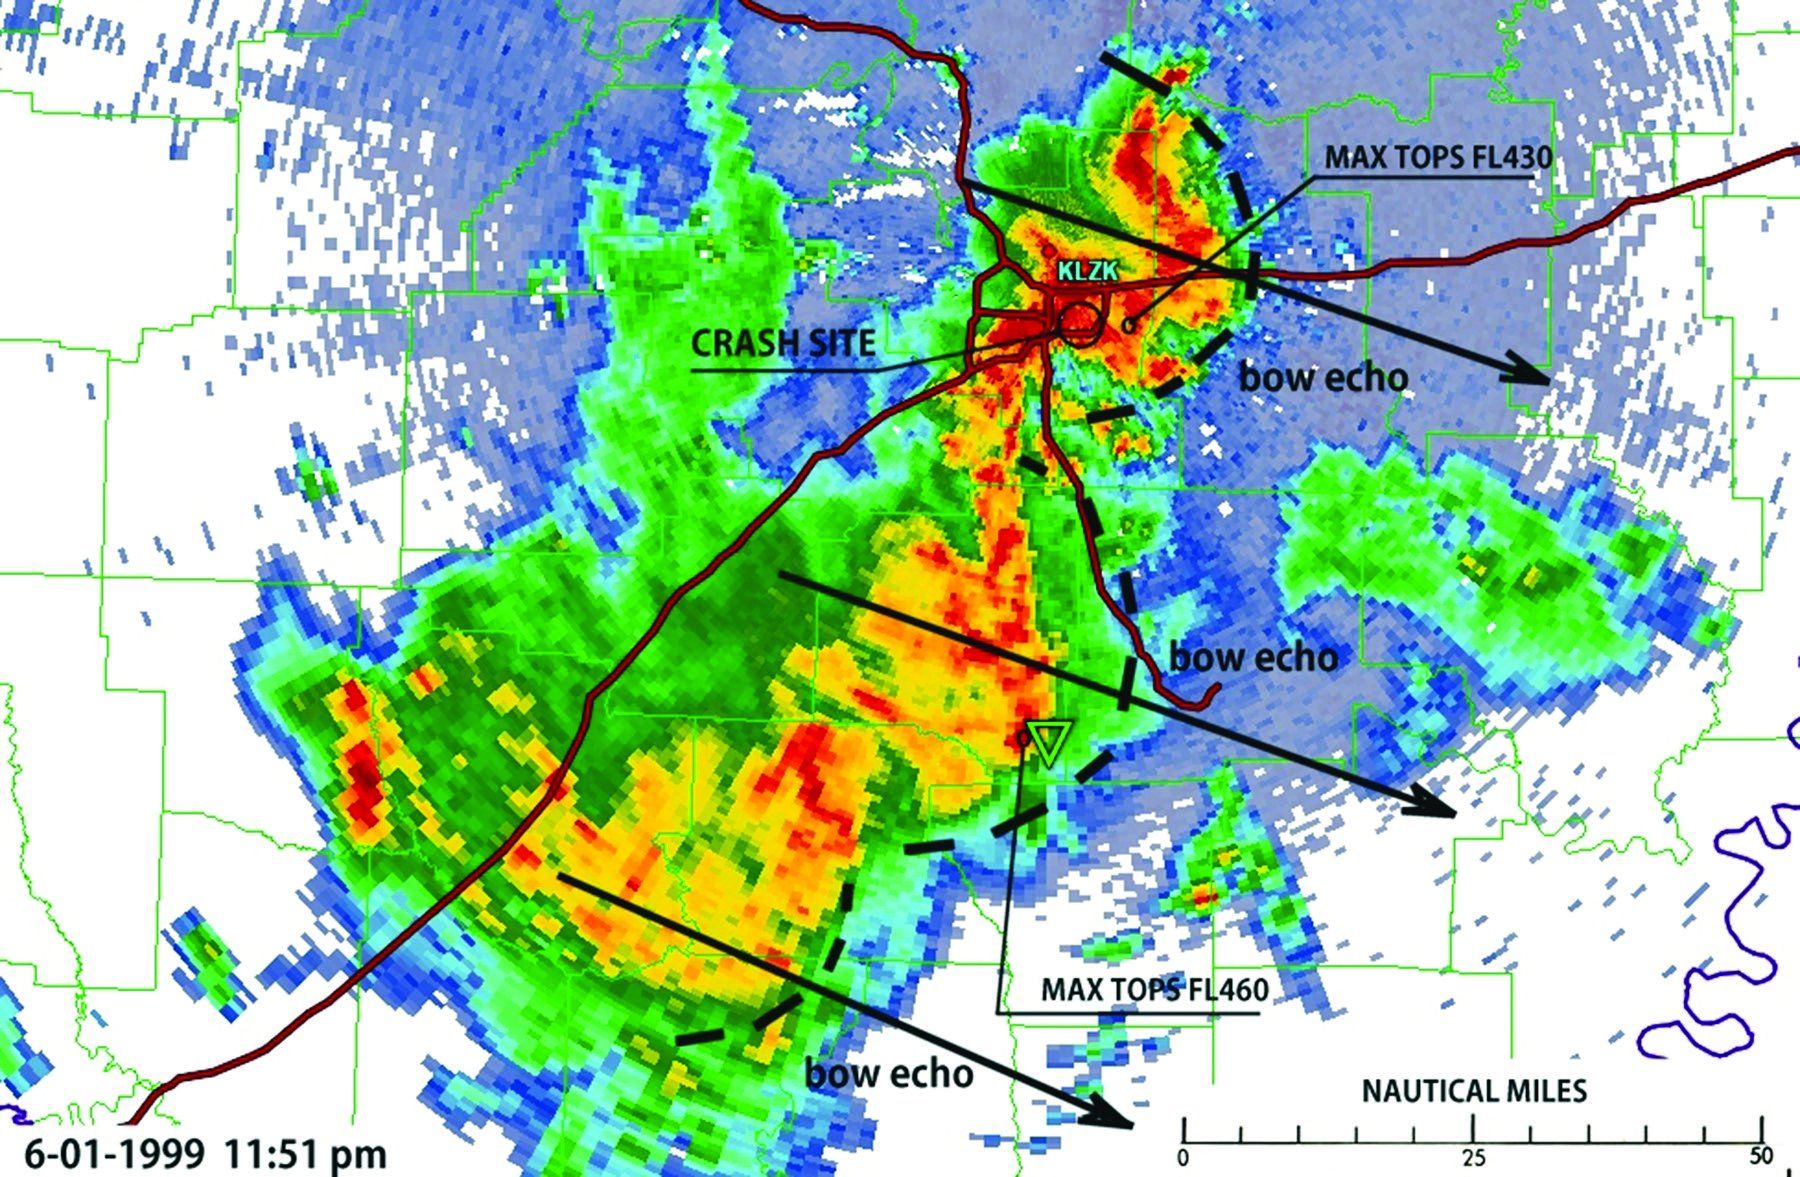
In environments with strong instability or shear, outflow-dominant storms may develop into “bow echoes,” which are shaped by the outflow pool and usually prompt warnings for high wind along their apex. The storm that battered Flight 1420 was part of the south edge of a weak bow echo centered 10 miles north of the airport (see image on this page). The airport was not in the typical danger spot from a bow echo, but still was lashed by its strong winds.
Bow echoes are not easily discernable on airborne radar because of the attenuation affecting short wavelength X-band sets. Ground-based radars such as those delivered by SiriusXM will detect bow echoes effectively, but they’re difficult to see on composite radar images because of the blending with higher-level echoes. This problem is covered in our radar articles such as “Painting the Weather” in the September 2017 Wx Smarts. Whether you’re seeing composite or base reflectivity depends on your source.
Bow echoes and derechos can be caused by dry air aloft, which can be entrained into downdrafts, resulting in stronger evaporation and denser parcels reaching the surface. High instability is another factor. In this case the culprit was lots of dry air, with the relative humidity dropping from 89 percent at 7000 feet to only three percent at 19,000 feet.
“Northwesterly flow” storms, where storm complexes move northwest to southeast, are often associated with dry air aloft in the central and eastern U.S. and have enhanced downburst potential. Watch for this in places like Kansas and Illinois in late spring.
What We Learned
What does this mean for the corporate or GA pilot? We’ve taught you a bit about what you’re seeing on radar and how to identify trouble. Bow echoes are something you might see on radar, but don’t take their absence as indicating it’s safe. Sometimes the expected shapes and patterns don’t appear. This is why we meteorologists rely on dozens of products to tease the radar data into a consistent picture, and that’s something that can only be done at a workstation.
Moreover, the saga of Flight 1420 should serve as a lesson on how quickly things can unravel during hazardous weather, especially when it’s been a long day and you’re starting to feel fatigued. Situations like these are where you must double your efforts to follow procedures, use common sense, and heed the “aviate, navigate, communicate” rule. The best pilots are valued not just on their ability to make correct decisions in a crisis, but because of their ability to diligently follow procedures even when things are going south. This is probably the biggest factor that marks the difference between an NTSB docket and an “I was there” bar story.
Tim Vasquez not only served as an aviation meteorologist in the Air Force but spent years studying the science of air disaster investigations. He appeared as an expert on CBS Evening News and The Weather Channel after the 2009 Air France crash.


