
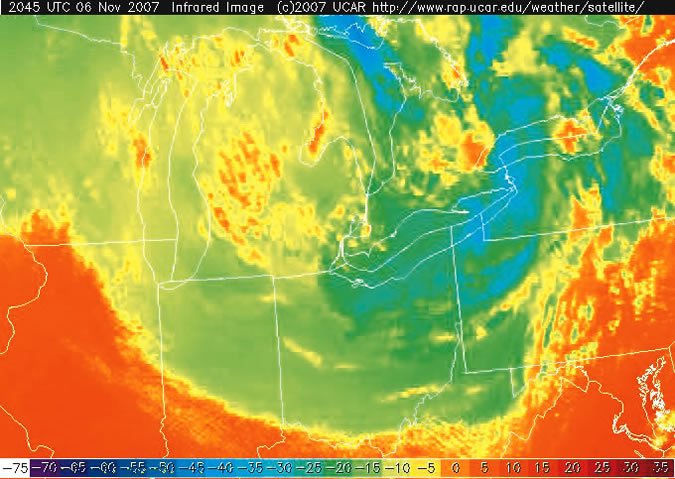
When it comes to avoiding structural icing, the enhanced infrared satellite image (http://aviationweather.gov/adds/satellite/) is one of the most under-utilized icing diagnostic tools available. Updated every 15 minutes, this satellite product can provide some amazing clues about the potential for structural icing, especially when combined with METARs, TAFs and NEXRAD. As a bonus, the technique also works very well at night.
The enhanced IR satellite image identifies the temperature of the cloud top in degrees Celsius. Simply match the color with the scale at the bottom. Having the temperature in hand, use a forecast sounding (http://rucsoundings.noaa.gov), close radiosonde observation to identify the height of the cloud tops.
In the top image, orange shows the temperature of the ground (clear air). The temperatures in south and central Ohio are mostly pale green with a hint of yellow, which indicates the tops are about -15 degrees C. Tops are darker green and blue to the north around Cleveland, signifying colder temperatures, and therefore, higher tops. This lets you predict how high, and how cold, the tops will be.
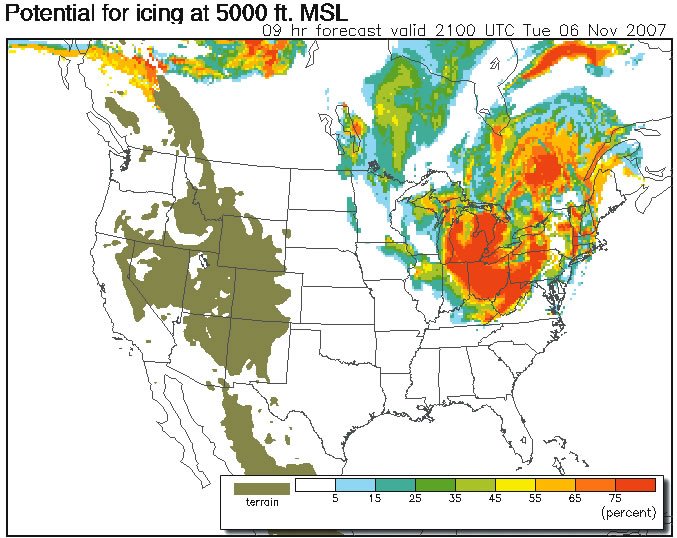
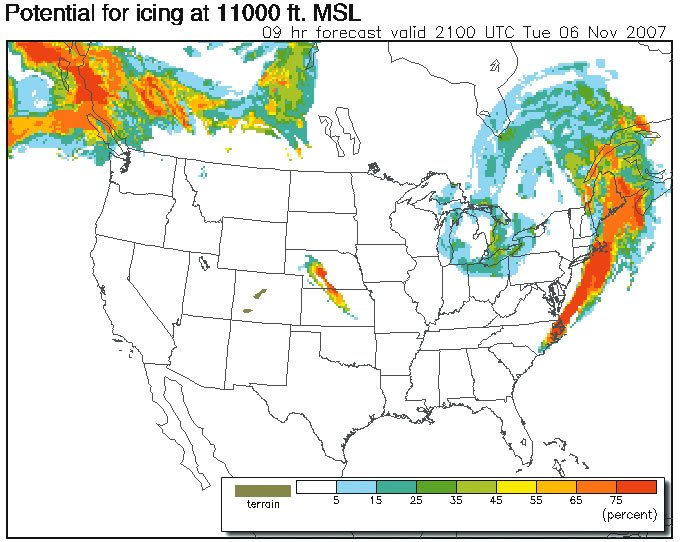
Another valuable resource is the supplemental icing diagnostic algorithms found on the Aviation Digital Data Service (ADDS) website (www.aviationweather.gov/adds). The Current Icing Product (CIP) and Forecast Icing Potential (FIP) have a distinct advantage because they are updated hourly and show any and all chance for structural icing.
The FIP for 5,000 feet shows a broad area of icing covering the Ohio Valley as well as most of the Upper and Lower Great Lakes. Flying at or near the MEAs on a direct route from Chicago to New York would be risky from an icing perspective, given the high likelihood shown here. By 11,000 feet, FIP is indicating a small likelihood of icing in northern Ohio, where the icing layer was much deeper, which is a good reason to keep a more southerly route.
Also available on the ADDS website are G-AIRMETs. They are relatively new and provide another resource that has a better temporal and spatial resolution than the traditional AIRMETs. Other advanced tools such as forecast soundings and analyses (http://rucsoundings.noaa.gov) can also be quite useful once you learn how to use them. Integrating these tools with area forecasts, TAFs, PIREPs and NEXRAD offers a more complete picture … and less risk of falling into an open manhole.
Scott Dennstaedt is an IFR Contributing Editor. His website is avwxworkshops.com.


